Sailing Topics
| Using MS Excel to Organize Ship Weather Reports from Saildocs |
| To the extent possible I like to see real weather reports when on a
voyage. Most of the weather products we use are forecast products (GRIBs,
NAVTEX, FAX, RTTY, etc.), which are very valuable. However as a
confidence factor I do like to see some observation data to validate
those forecasts. Unfortunately very little observation data is
available in the middle of the ocean. One source of this data are the
ship and weather buoy data collected and disseminated by NOAA and other
national weather services. This data is available from SailDocs through
either Winlink or SailMail. However, the data as presented from SailDocs is difficult to use as you have to find the reports that are close to your position or along your planned route to gain any meaningful information. To make this data more useful I developed the Ship Weather Reports Excel workbook template. This template allows the weather reports to be sorted based on distance from your vessel's position, identifying those reports (if any) that are in your vicinity. Although this template makes the weather data more accessible, using the template requires a number of steps that are more easily described by pictures than written instructions. Hence this page to guide you through the use of the template. Each of the steps described below is accompanied by a screen capture of the process. The screen captures are displayed in a reduced thumbnail image, however the full size image can be viewed by double-clicking on the thumbnail. After you have reviewed the procedure you may want to watch the YouTube video at the end of this section to walk through all the steps. |
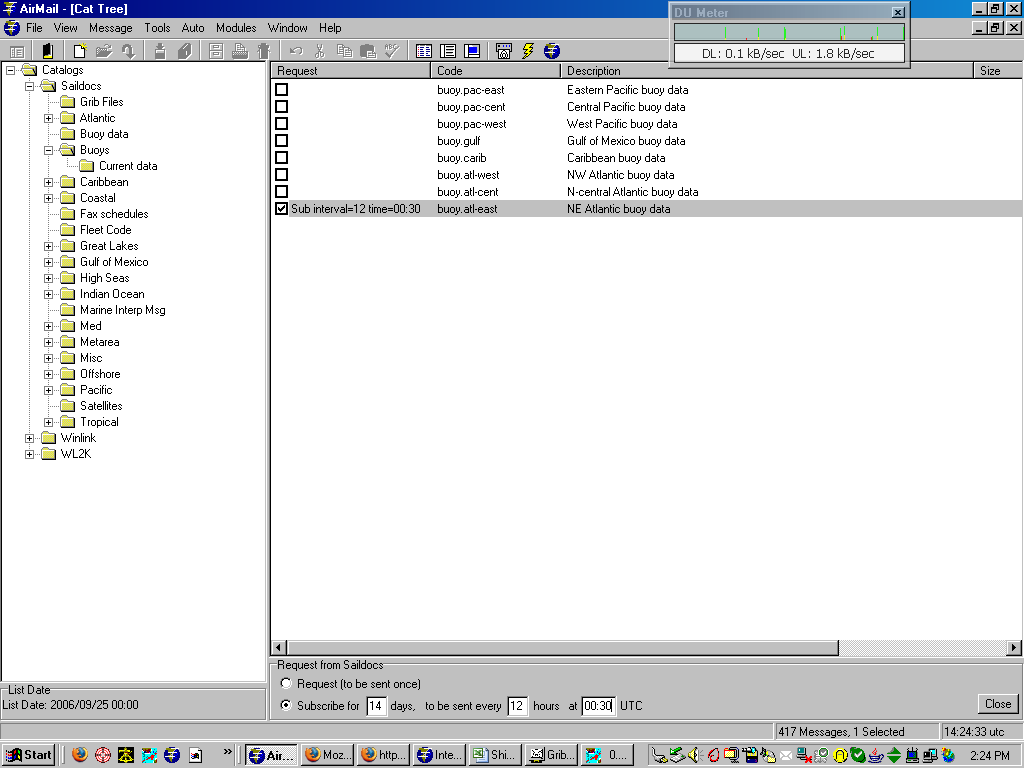 The
first step is to retrieve the weather data from Saildocs. In the screen
capture on the lef I have set up a subscription to the NE Atlantic
Buoy Data bulletin. Although the title of this bulletin implies it is
limited to buoy data, it also includes weather reports from ships. Most
of the buoys are located in and around the major shipping lanes and
along the coast. There are relatively few buoys more than 100 nm
off-shore. For that reason the ship reports can be much more important
than the buoy reports. The
first step is to retrieve the weather data from Saildocs. In the screen
capture on the lef I have set up a subscription to the NE Atlantic
Buoy Data bulletin. Although the title of this bulletin implies it is
limited to buoy data, it also includes weather reports from ships. Most
of the buoys are located in and around the major shipping lanes and
along the coast. There are relatively few buoys more than 100 nm
off-shore. For that reason the ship reports can be much more important
than the buoy reports.The problem with ship reports is that they are not taken and transmitted as often as buoy data. Most ships send their observations only for the main synoptic data reporting hours (00, 06, 12, and 18 hours). If you request the reports without a subscription you need to time the sending of the request so that it will capture the data for one of the main reporting hours. Otherwise you might receive a bulletin will only a few reports and none in you vicinity. This data currently comes from http://coolwx.com . Normally coolwx.com posts the initial reports for the latest hour between 5 and 6 minutes after the hour. Every 15 minutes, or so, coolwx.com updates the page with any additional reports that have arrived since the last update. I do not really know how often Saildocs retrieves the bulletin. It appears Saildocs retrieves the web page from coolwx.com every half hour at 5 and 35 minutes past the hour. It also appears that when a request for this document is received (or generated by a subscription) Saildocs will wait until the next retrieval before sending the data to the requester. So the key is to request the Buoy Data bulletin just prior to one of Saildocs retrievals (5 and 35 minutes after the hour). The 5 minute after the hour retrieval is right on the edge of the initial update of the coolwx.com web page. A few seconds one way or the other and you might receive data from the previous or current hour. Since the synoptic reporting times contain the greatest amount of data I want to insure I get the data for those hours. Therefore the safe bet is to go for the 35 minute Saildocs retrieval by requesting the bulletin anytime between 10 minutes and 30 minutes after the hour. By that time coolwx.com should have captured all of the reports that will be received for that hour. I have set up a subscription to receive NE Atlantic Buoy Data bulletin every 12 hours, with the first bulletin captured at 00:30. This capture time generate a Saildocs message with the 00z data around 00:35 minutes after the hour. I can then log in to Winlink any time after 00:35 and expect to have the bulletin on the queue for my station. The next bulletin will be available at 12:35 with the 12z data. |
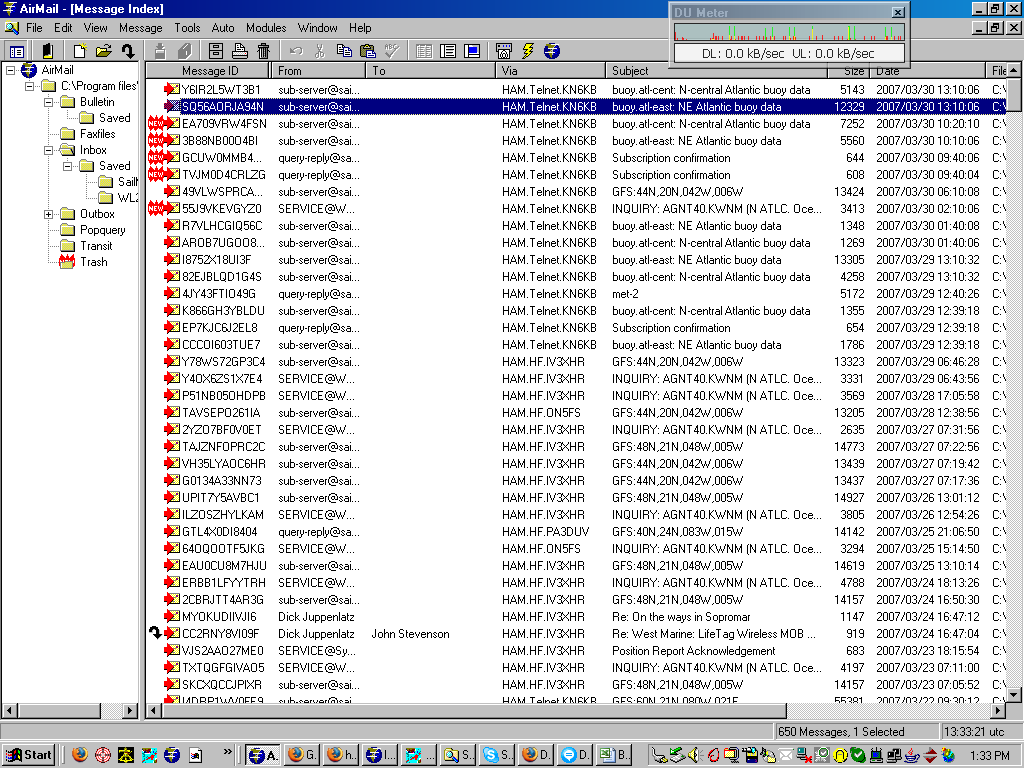 In
this screen capture the buoy report for the NE Atlantic has been
received in Airmail and highlighted. In
this screen capture the buoy report for the NE Atlantic has been
received in Airmail and highlighted. |
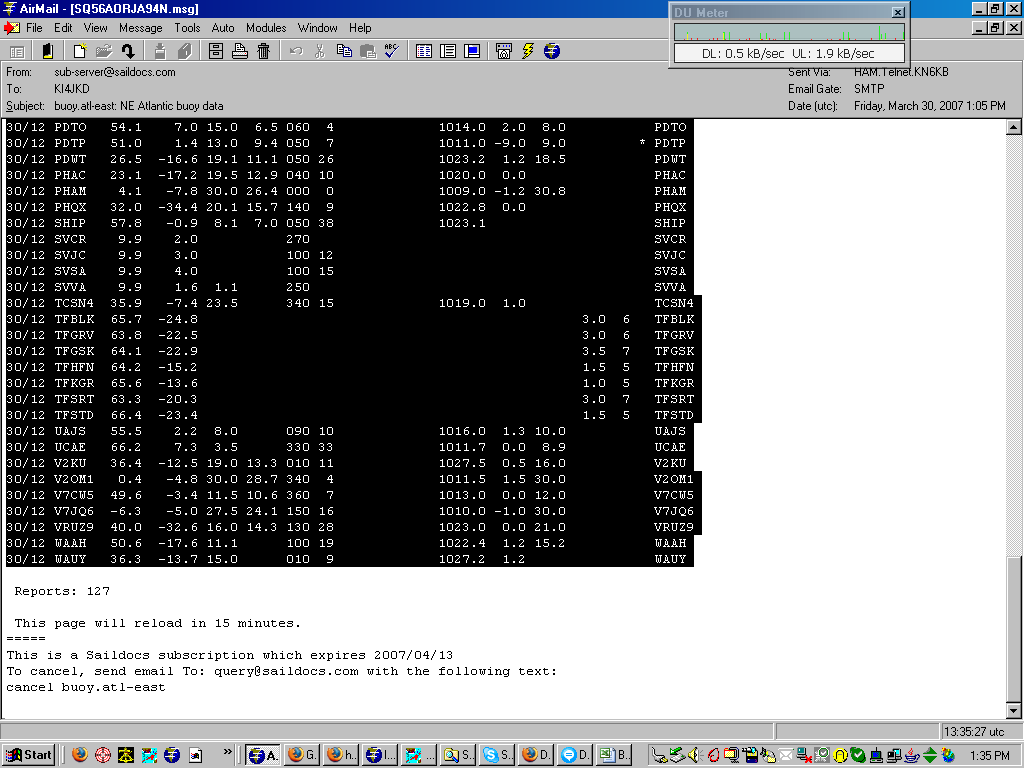
 Here,
the buoy bulletin for 12z has been opened in Airmail and I have started
to select the data in the bulletin. Notice that this message was sent
by Saildocs at 13:05:12 (second line from the top) with data from
coolwx.com that was updated at 13:00:53. This message was retrieved
using a subscription starting at 00:45, not 00:30 as shown in the first
screen above. Fortunately Saildocs retrieved this data a few seconds
before coolwx.com replaced it with the initial data for 13z. At the
bottom of this page I have an example of what happens if the
Saildocs retrieval is a few seconds later. Here,
the buoy bulletin for 12z has been opened in Airmail and I have started
to select the data in the bulletin. Notice that this message was sent
by Saildocs at 13:05:12 (second line from the top) with data from
coolwx.com that was updated at 13:00:53. This message was retrieved
using a subscription starting at 00:45, not 00:30 as shown in the first
screen above. Fortunately Saildocs retrieved this data a few seconds
before coolwx.com replaced it with the initial data for 13z. At the
bottom of this page I have an example of what happens if the
Saildocs retrieval is a few seconds later.In this screen capture I have started the selection with the first report in the bulletin and have not included the column headers.
|
 Now
I have completed the selection of the data using the mouse to include
the last report in the bulletin. At this point the data should be
copied to the Windows Clipboard using Ctrl-C, the Edit/Copy menu
command, or the copy button on the Airmail toolbar. Now
I have completed the selection of the data using the mouse to include
the last report in the bulletin. At this point the data should be
copied to the Windows Clipboard using Ctrl-C, the Edit/Copy menu
command, or the copy button on the Airmail toolbar. |
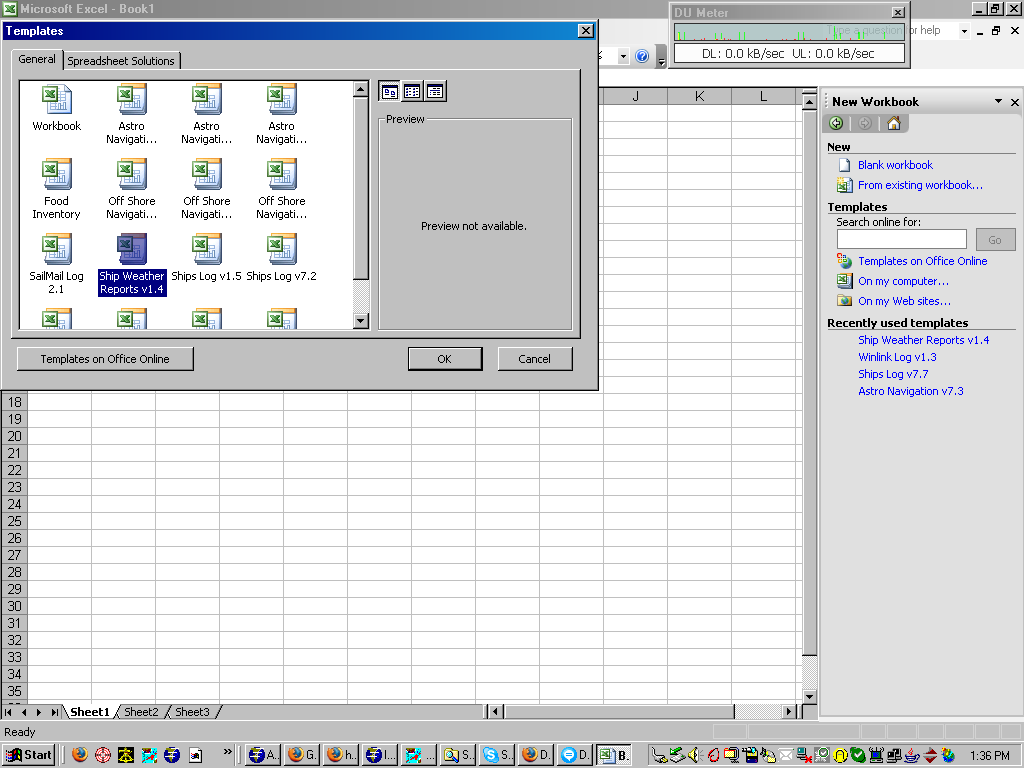 Now
that the weather data is on the Clipboard we need to create the workbook
for the data. After starting Excel, create a new workbook using the
File/New menu command, then select "Templates..On my computer" from the
New Workbook frame on the right side of the screen. This will open the
Templates window. You should have already downloaded and saved the Ship
Weather Reports file as a template and it should show up in the general
tab in the Templates window. Now
that the weather data is on the Clipboard we need to create the workbook
for the data. After starting Excel, create a new workbook using the
File/New menu command, then select "Templates..On my computer" from the
New Workbook frame on the right side of the screen. This will open the
Templates window. You should have already downloaded and saved the Ship
Weather Reports file as a template and it should show up in the general
tab in the Templates window.Select the Ships Weather Report template and click OK. |
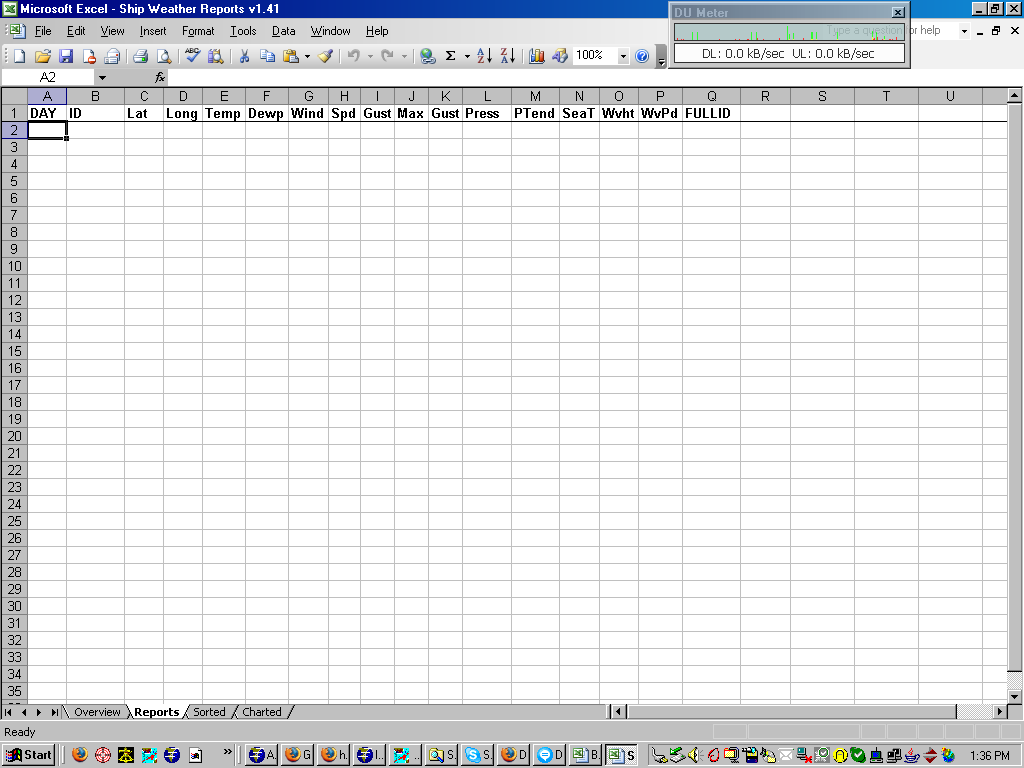 Now
the new workbook has been created from the Ships Weather Report
template. It should open in the Reports worksheet. If not click on the
Reports tab at the bottom of the Excel window and click on the cell in
the upper left corner of the worksheet, just below the column headers. Now
the new workbook has been created from the Ships Weather Report
template. It should open in the Reports worksheet. If not click on the
Reports tab at the bottom of the Excel window and click on the cell in
the upper left corner of the worksheet, just below the column headers. |
 Next
paste the data from the Clipboard into the worksheet using either the
Edit/Paste menu, the Paste button on the Excel toolbar or the Ctrl-V
keyboard command. Next
paste the data from the Clipboard into the worksheet using either the
Edit/Paste menu, the Paste button on the Excel toolbar or the Ctrl-V
keyboard command.On the left the data has been pasted into the Column A of the worksheet. |
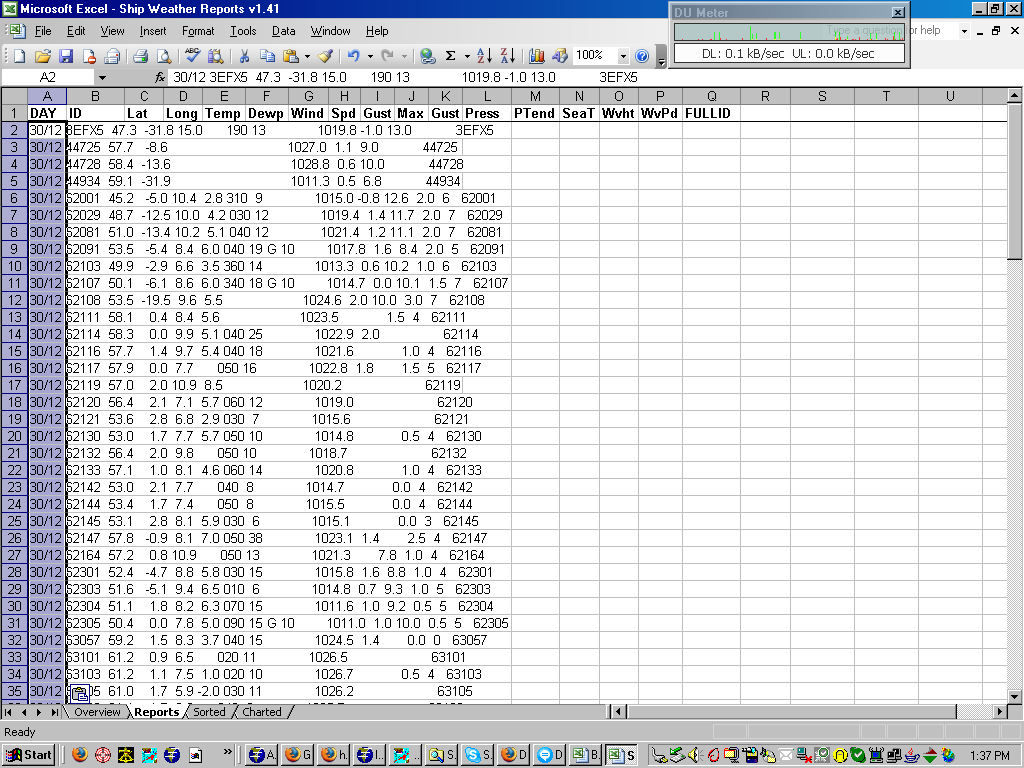
 Next
the data must be parsed into columns. You can do this manually using
the Data/Text to Columns menu, but I have built in a macro to parse the
data. The macro is activated by the Ctrl-B keyboard command. Next
the data must be parsed into columns. You can do this manually using
the Data/Text to Columns menu, but I have built in a macro to parse the
data. The macro is activated by the Ctrl-B keyboard command.The screen capture on the left shows the parsed data, with each element of the reports in a separate column. However the data is still in the unorganized format of the bulletin received from SailDocs. This template was created based on the bulletin format retrieved by Saildocs from the http://coolwx.com website. If that format changes, then this template will likely have to be modified to accommodate those changes. The next step is to sort the data. |
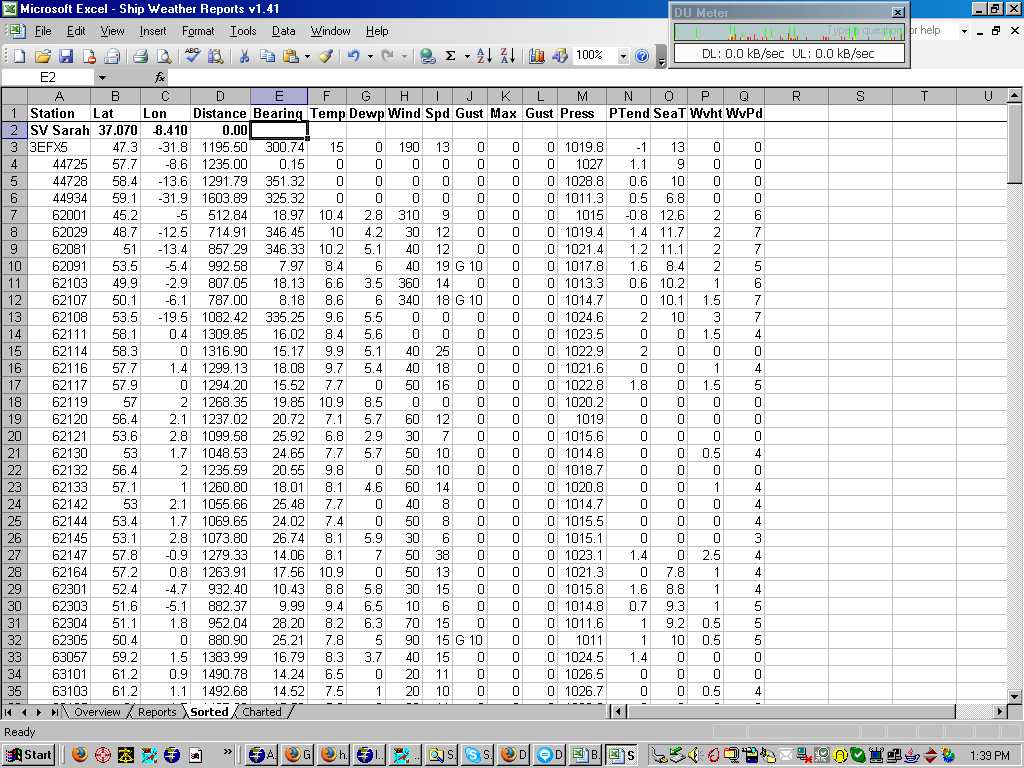 To
sort the data move to the Sorted worksheet by clicking on the "Sorted"
tab at the bottom of the Excel window. Here you will find the same data
you just pasted into the Reports worksheet. The first column of the
Reports worksheet has been eliminated as it is the same for all
reports. To
sort the data move to the Sorted worksheet by clicking on the "Sorted"
tab at the bottom of the Excel window. Here you will find the same data
you just pasted into the Reports worksheet. The first column of the
Reports worksheet has been eliminated as it is the same for all
reports.
This worksheet also has a row above the data with the name and position of your vessel. The downloaded template has the name of my boat (SV Sarah), which you can change to your boat's name (or leave it alone as it has no effect on the sorting). What does have affect on the sorting is the position of your ship which should be filled in the the Lat and Lon columns using the format ddd.mmt, where
Two columns have been added to each report, Distance and Bearing. The values in these columns are calculated from the latitude and longitude of your ship and the latitude and longitude in each report. The distance is in nautical miles and the bearing is the true compass direction from your position to that of each ship or buoy. Once your position has been entered, the data can be sorted to find the reports closest to your position. |
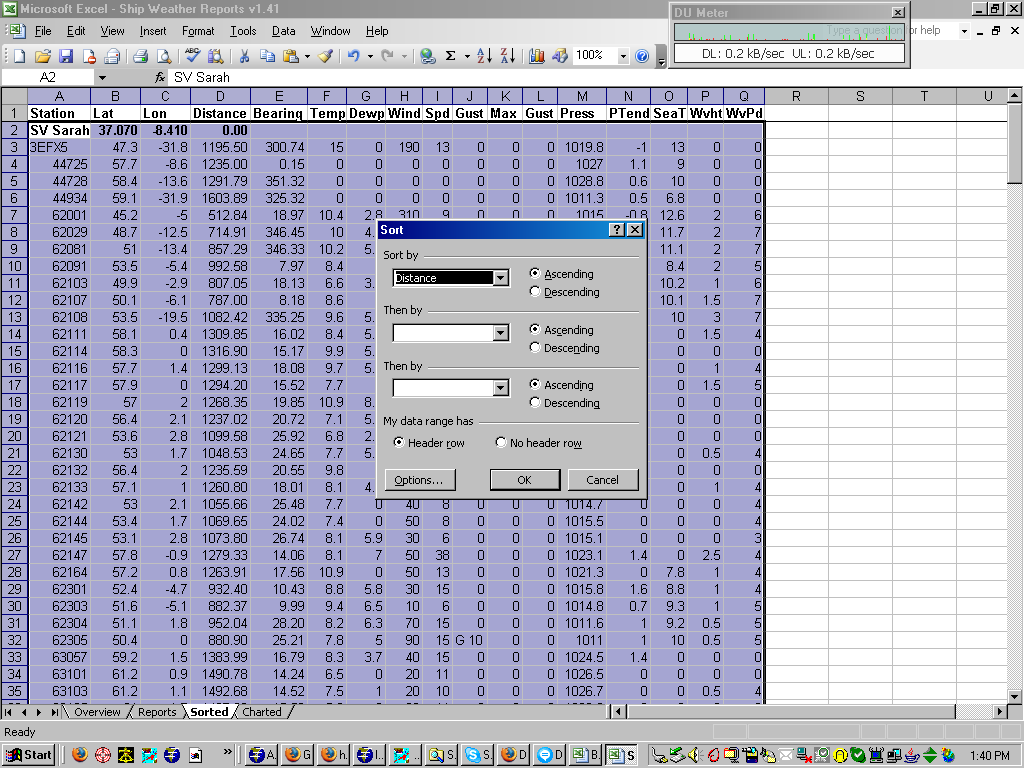 Use
the standard Excel sort via the Data/Sort menu. The workbook should
default to the sort parameters shown in the screen capture on the left.
If not set them up by clicking on the "My data range has...Header row"
radio button, then select the "Distance" column in the Sort by drop-down
list. Click "Ascending" order and OK. Use
the standard Excel sort via the Data/Sort menu. The workbook should
default to the sort parameters shown in the screen capture on the left.
If not set them up by clicking on the "My data range has...Header row"
radio button, then select the "Distance" column in the Sort by drop-down
list. Click "Ascending" order and OK. |
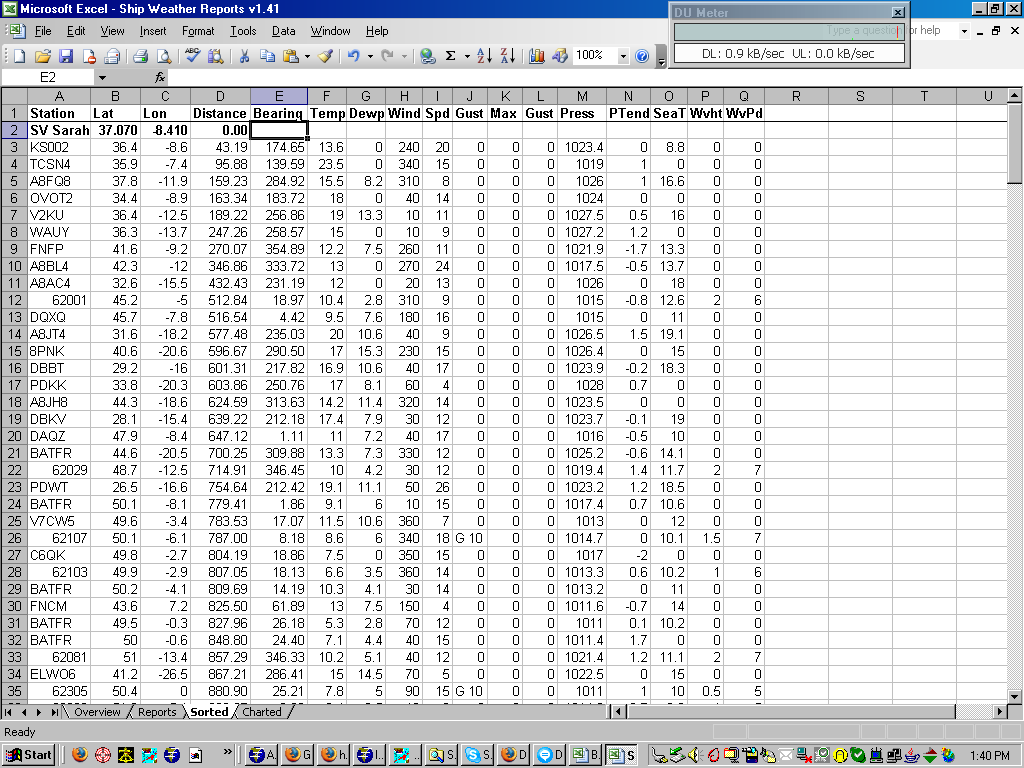 Now
the data has been sorted by distance from your vessel's position with
the closest reports at the top of the list. Now
the data has been sorted by distance from your vessel's position with
the closest reports at the top of the list.Here we can see that KS002 is approximately 43 nm south of Sarah. TCSN4 is 96 nm SE of Sarah and A8FQ8 is 160 nm west of Sarah. |
 There
is also a graphical display of the distribution of the reporting ships
and buoys on the "Charted" worksheet. Here the position of each report
is plotted in relation to your ship's position (yellow square). There
is also a graphical display of the distribution of the reporting ships
and buoys on the "Charted" worksheet. Here the position of each report
is plotted in relation to your ship's position (yellow square).This is just a X-Y linear plot and is not a true chart projection. The only value of this worksheet to provide a quick view of how many reports are in your area. Those are the basic steps in using this Excel Workbook template. A few more steps may be necessary depending on how many reports are in the bulletin downloaded from SailDocs. The template is built to handle a bulletin of up to 245 reports. If the actual bulletin has fewer than that many reports, the Sorted and Charted worksheets will include a number of null reports. If you look at the screen capture you will see a red diamond on the 0,0 Lat,Lon coordinate. This is actually the plot of a number of null reports. This not normally a problem unless your position is close to 0,0. If that is the case, before performing the sort, deleted the rows in Sorted with null reports (all columns contain zero). If you've already done the sort it can normally be reset with the Undo command in Excel. In the event that the bulletin contains more than 245 reports (possible on the synoptic hours) only the first 245 in the bulletin will be picked up in the Sorted and Charted worksheets. The Overview tab in the template describes how to expand and decrease the number of reports picked up in the Sorted tab. Since you will be working with a workbook created from the template, changes you make to the workbook will not change the template or any subsequent workbook generated by the template. To permanently change the number of reports captured by each workbook the changes must be made to the template. Adding rows to the Sorted worksheet will slow down the processing of the workbook because there will be more distance and bearing calculations to perform. I have expanded the rows to 1,000 with minimal impact on performance. |
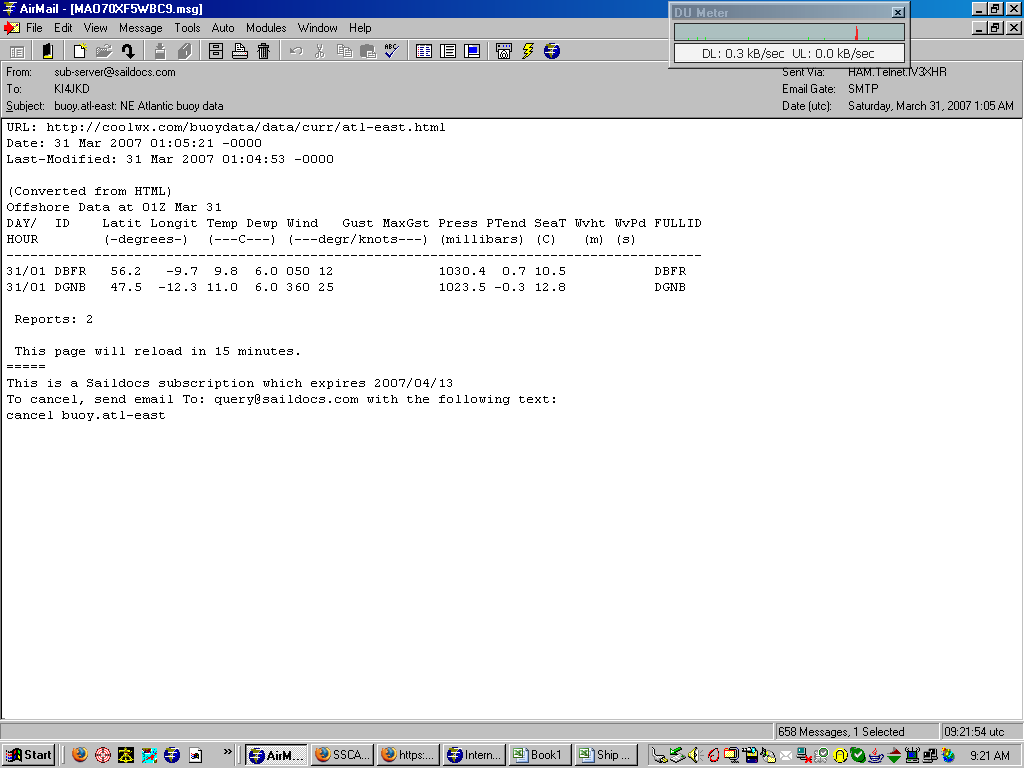 This
screen capture shows what can happen when Saildocs does not retrieve the
bulletin from the Internet before coolwx.com replaces it with the intial
data for the next hour. This document was retrieved with a subscription
starting at 00:45 instead of 00:30. Saildocs waited until around 5
minutes after the hour to retrieve the data from coolwx.com.
Unfortunately this retrieval was just after coolwx.com replaced the 00z
data with the initial 01z data. You can see what happened - only two
reports and none in my area. This
screen capture shows what can happen when Saildocs does not retrieve the
bulletin from the Internet before coolwx.com replaces it with the intial
data for the next hour. This document was retrieved with a subscription
starting at 00:45 instead of 00:30. Saildocs waited until around 5
minutes after the hour to retrieve the data from coolwx.com.
Unfortunately this retrieval was just after coolwx.com replaced the 00z
data with the initial 01z data. You can see what happened - only two
reports and none in my area.This why it is best to use a subscription start time between 10 and 30 minutes after the hour. |
| Below is a YouTube video that walks you through the steps described above. |
| Another Way to Use This Template |
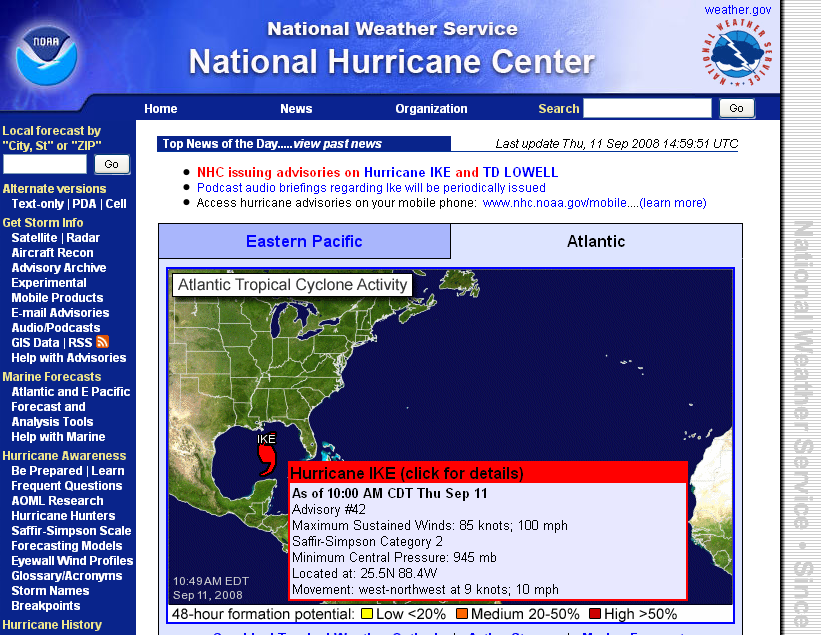
| I developed this Excel Template to identify ship and buoy reports near my position when on a passage. This summer (2008) I discovered another use for the template. While monitoring Hurricane Ike as it moved across the Gulf of Mexico toward the coast of Texas, I realized there was a lot of buoy data in the Gulf that could provide a measurement of the winds associated with this storm. I was also interested if any ships were in the vicinity of this storm. The screen capture below shows the position of Ike at 15:00 UTC on Sep 11. |
 |
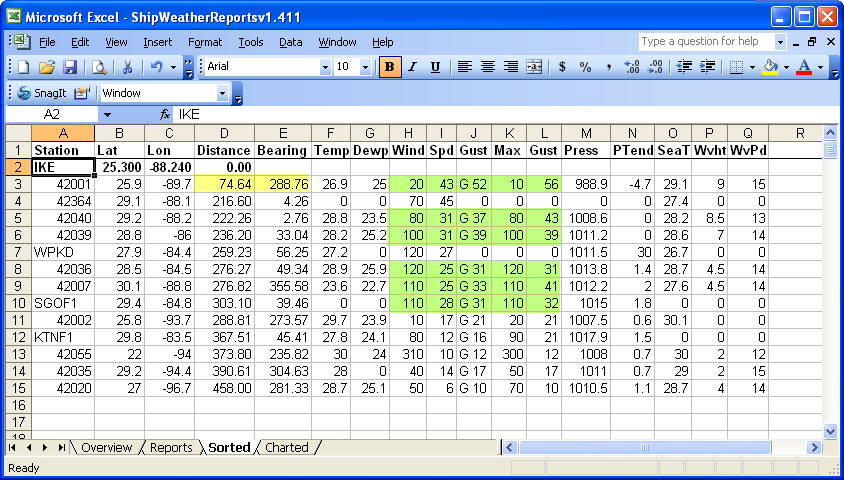
| So I downloaded the buoy/ship report from Saildocs for 15:00 and
parsed it with the ShipWeatherReport template. The screen capture
below shows the reports I downloaded. As 15:00 is not a standard synoptic
reporting time, the number of observations is limited. Instead
of using my ship's position as the baseline for the analysis, I used the
15:00 UTC position of Ike. The spreadsheet analysis now lists the
weather observations that are closest to the reported position of Ike.
Buoy 42001 is about 75nm due west of Ike's position and is reporting NNE winds of 43 kts gusting to 52 kts with a maximum gust of 56 kts. Obviously Ike is a major tropical storm. This fact is supported by the reports from other buoys as distant from Ike as 300 miles, but still reporting winds over 30 kts. Interestingly one ship, WPKD, is within 260 nm of Ike. This really doesn't have much to do with analyzing weather data on an ocean passage, but it is still kinda neat for a weather junkie like myself. |
 |