Sailing Topics
| Importing Pilot Charts Into Fugawi (or other chart plotting software that can calibrate chart image files) |
| The chart import technique described on this web page is largely out-of-date because the OpenCPN group provides the NGA Pilot Charts in KAP format that can be displayed directly by any chart plotting software that handles BSB format charts (e.g., NOAA RNCs). I've left this page up in case someone wants to see what we had to go through to acquire electronic charts only a few years ago. |
| Most sailors are familiar with the Pilot Charts produced by the National
Geospatial-Intelligence Agency (NGA) and the hydrographic offices of a
number of other countries. These charts can be very useful in developing a
strategy and timeframe for an ocean voyage. The charts provide a great deal
of climatology information in a graphical format superimposed on a map of
the oceans and seas. There are five NGA Pilot Chart sets (North Atlantic, South Atlantic, North Pacific, South Pacific and Indian Oceans). Each set includes one chart for each month of the year. Until recently the NGA Pilot Charts were available only on paper and in a large format booklet about the same size as the Maptech ChartKits many of us use for coastal navigation. The problem with the paper Pilot Charts is that they are a little clumsy to work with and take up a lot of space for something you might use at most once or twice each year. Also most cruising sailors have adapted to one extent or another to electronic navigation using a chart plotter. Many of us like to use the chart plotter as one of our route planning tools and would like to be able to integrate the information on a Pilot Chart with those tools. A few years ago NGA published the Pilot Chart sets (and many other publications) in Adobe PDF format and made them available for download from the Internet. So now we can get the charts electronically, but unless you have Adobe Acrobat or some other publishing software for PDF files you can only browse them. You can't draw routes on them and Adobe Reader is not really designed for large format graphical documents such as the Pilot Charts. Those of use who use navigational software on our PCs have a tool that was designed to work with these kinds of charts, but few if any of those software packages can work with native PDF files. Most chart plotting software designed for raster charts have the capability to import a chart image in one or more of the standard graphic file formats (JPEG, BMP, PNG, TIFF, etc.). So if we could only get the pilot charts into one of those formats we could manipulate the Pilot Charts with our chart plotting software. Fortunately the PDF files provided by NGA allow you to do just that. In setting up the PDF files NGA allows the user to select and extract portions (or all) of each page of Pilot Chart sets. Following is a description of how I import Pilot Charts into the Fugawi software. Most other raster chart plotting software packages also have this capability, only the specific process steps will differ. The first step no matter what chart plotting software is used, is to get the chart out of the PDF format and into one of the graphic formats supported by the plotting software. Of course if you own Adobe Acrobat you probably don't need the first two steps. I assume Acrobat will allow you to export directly to a standard graphic file format. |
There are three basic steps in this process:
I've added an alternative to the first two steps: Using a screen capture tool, such as SangIT, to copy the chart to a graphic file. I've provided some detail on these steps below. |
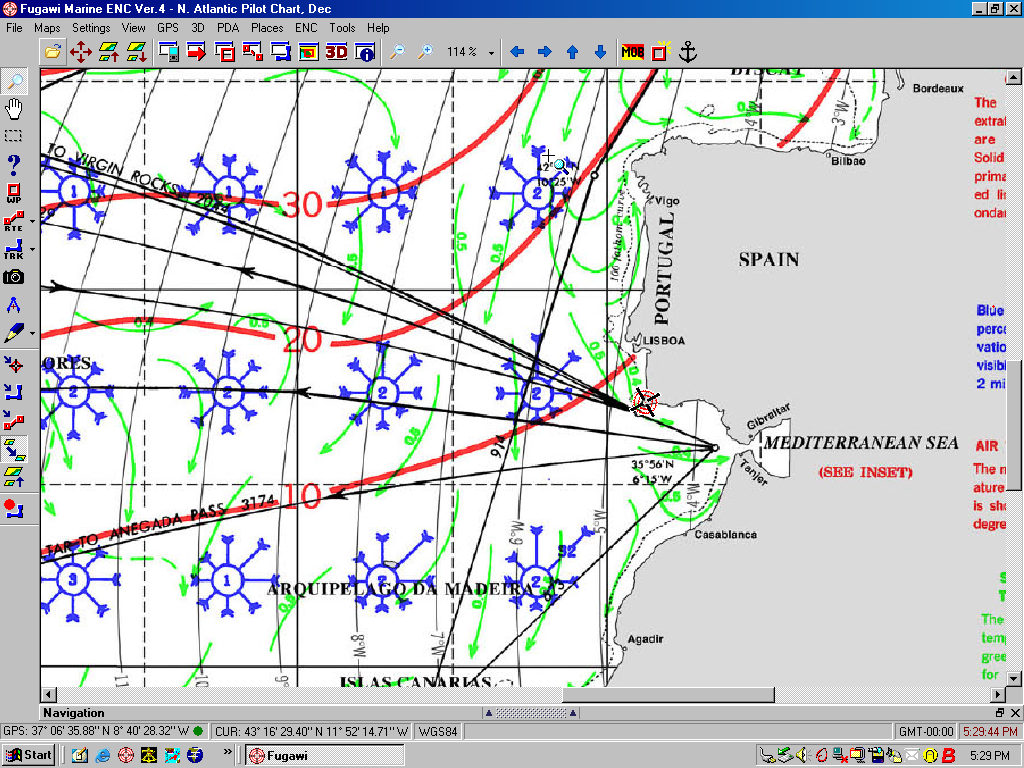
| Step 1: Extract the Pilot Chart to the Clipboard. |
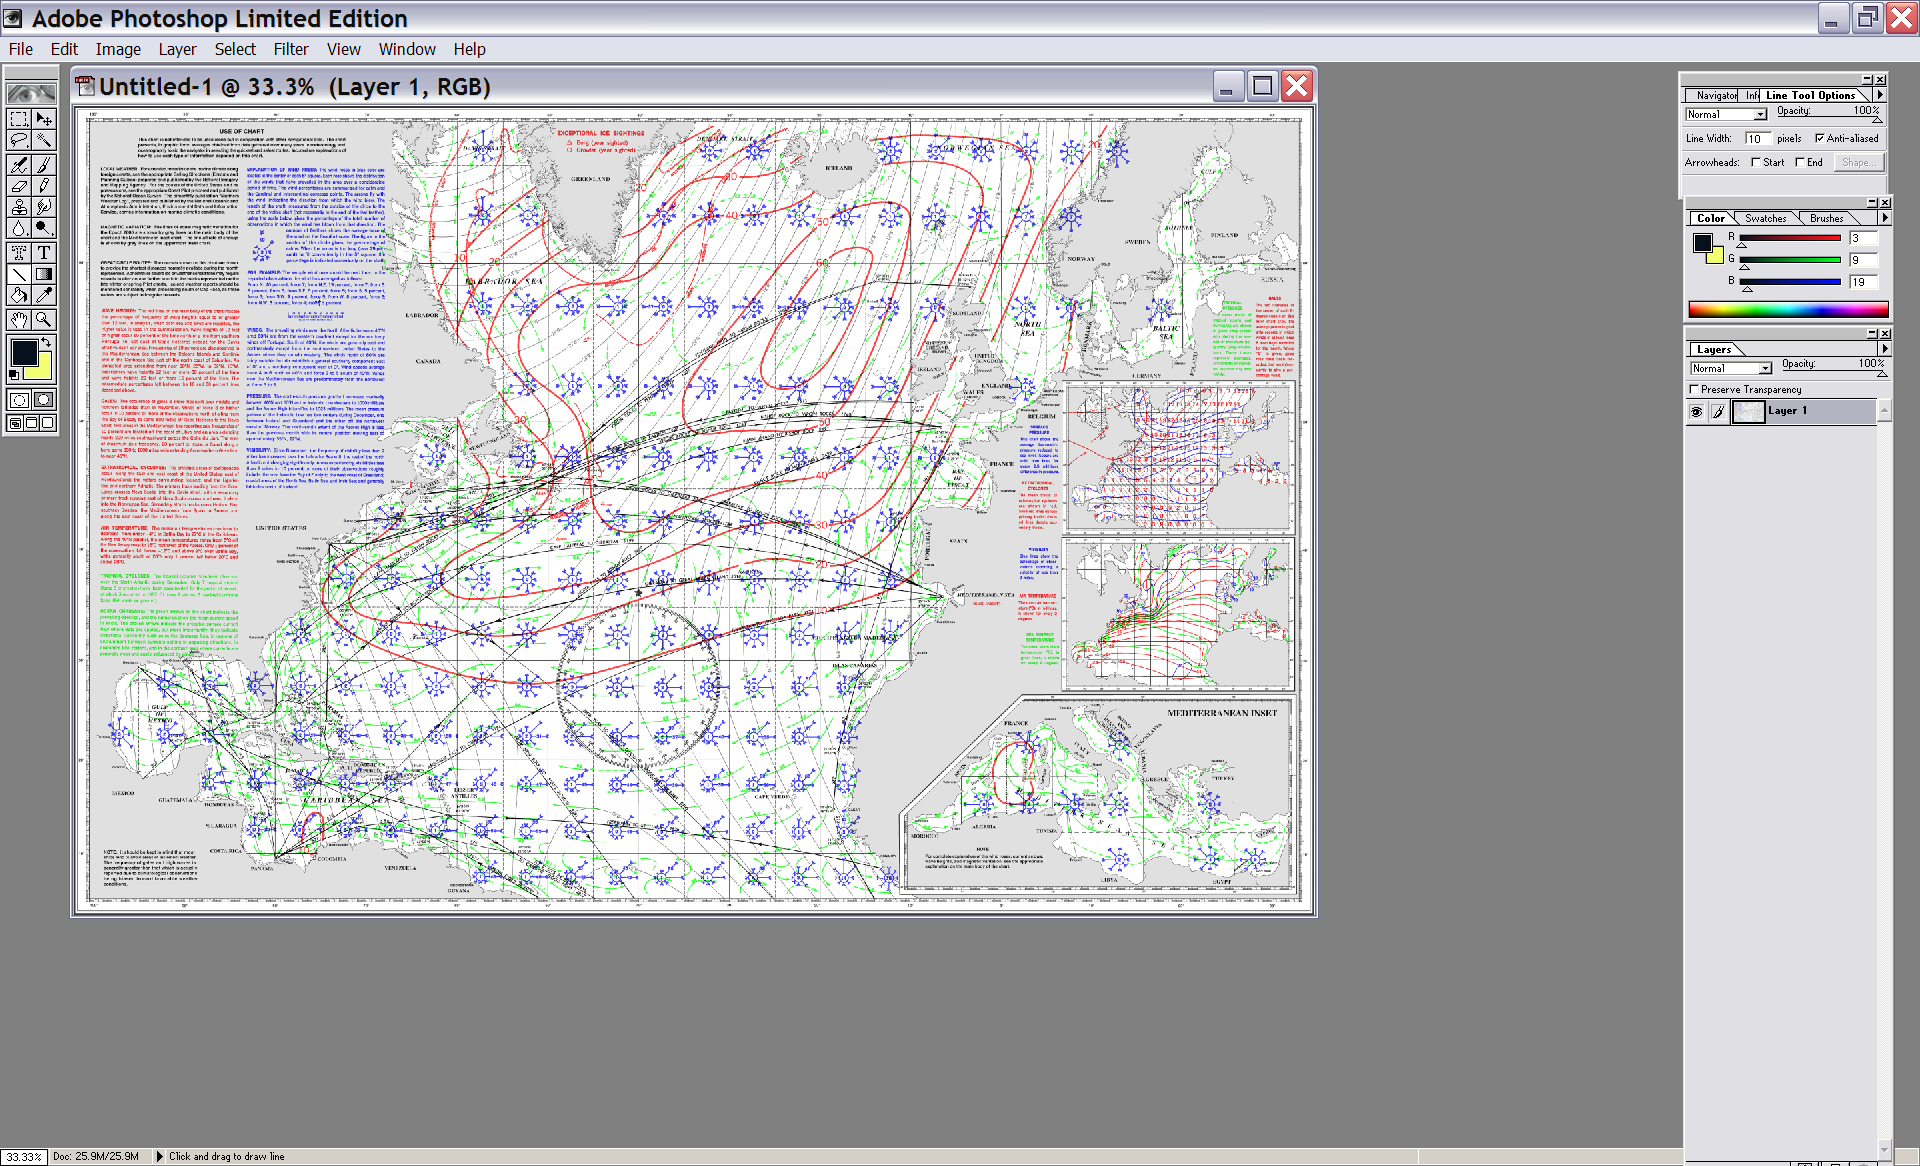
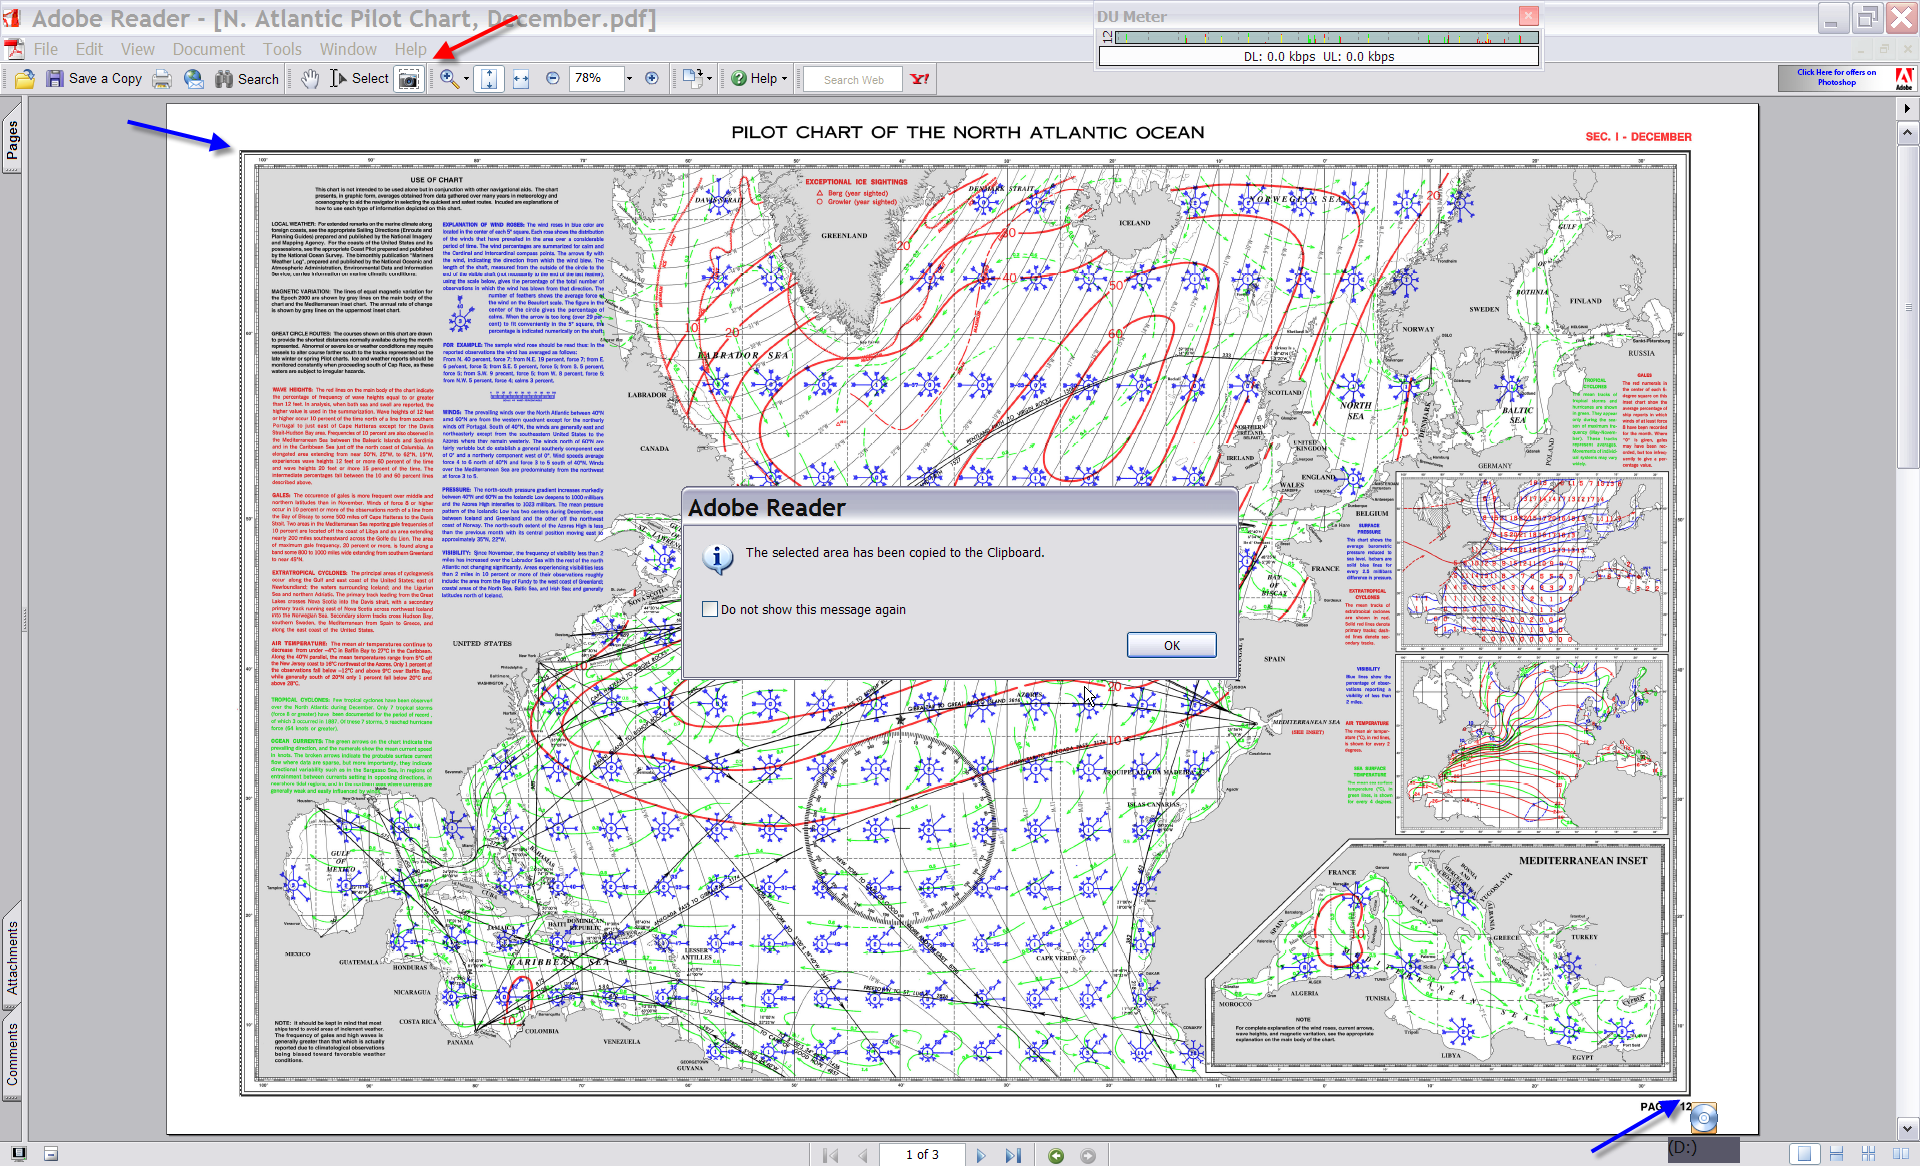 In
the screen capture on the right I have used the Snap Shot Tool (Identified
by the red arrow at the top of the screen) to select and extract the
December Pilot Chart for the North Atlantic Ocean. The limits that I
selected are shown by the blue arrows in the upper left and bottom right
corners of the screen. These blue and red arrows are annotations I've added
to the screen image. They are not part of the PDF file, nor were they
generated by Adobe Reader. In
the screen capture on the right I have used the Snap Shot Tool (Identified
by the red arrow at the top of the screen) to select and extract the
December Pilot Chart for the North Atlantic Ocean. The limits that I
selected are shown by the blue arrows in the upper left and bottom right
corners of the screen. These blue and red arrows are annotations I've added
to the screen image. They are not part of the PDF file, nor were they
generated by Adobe Reader. |
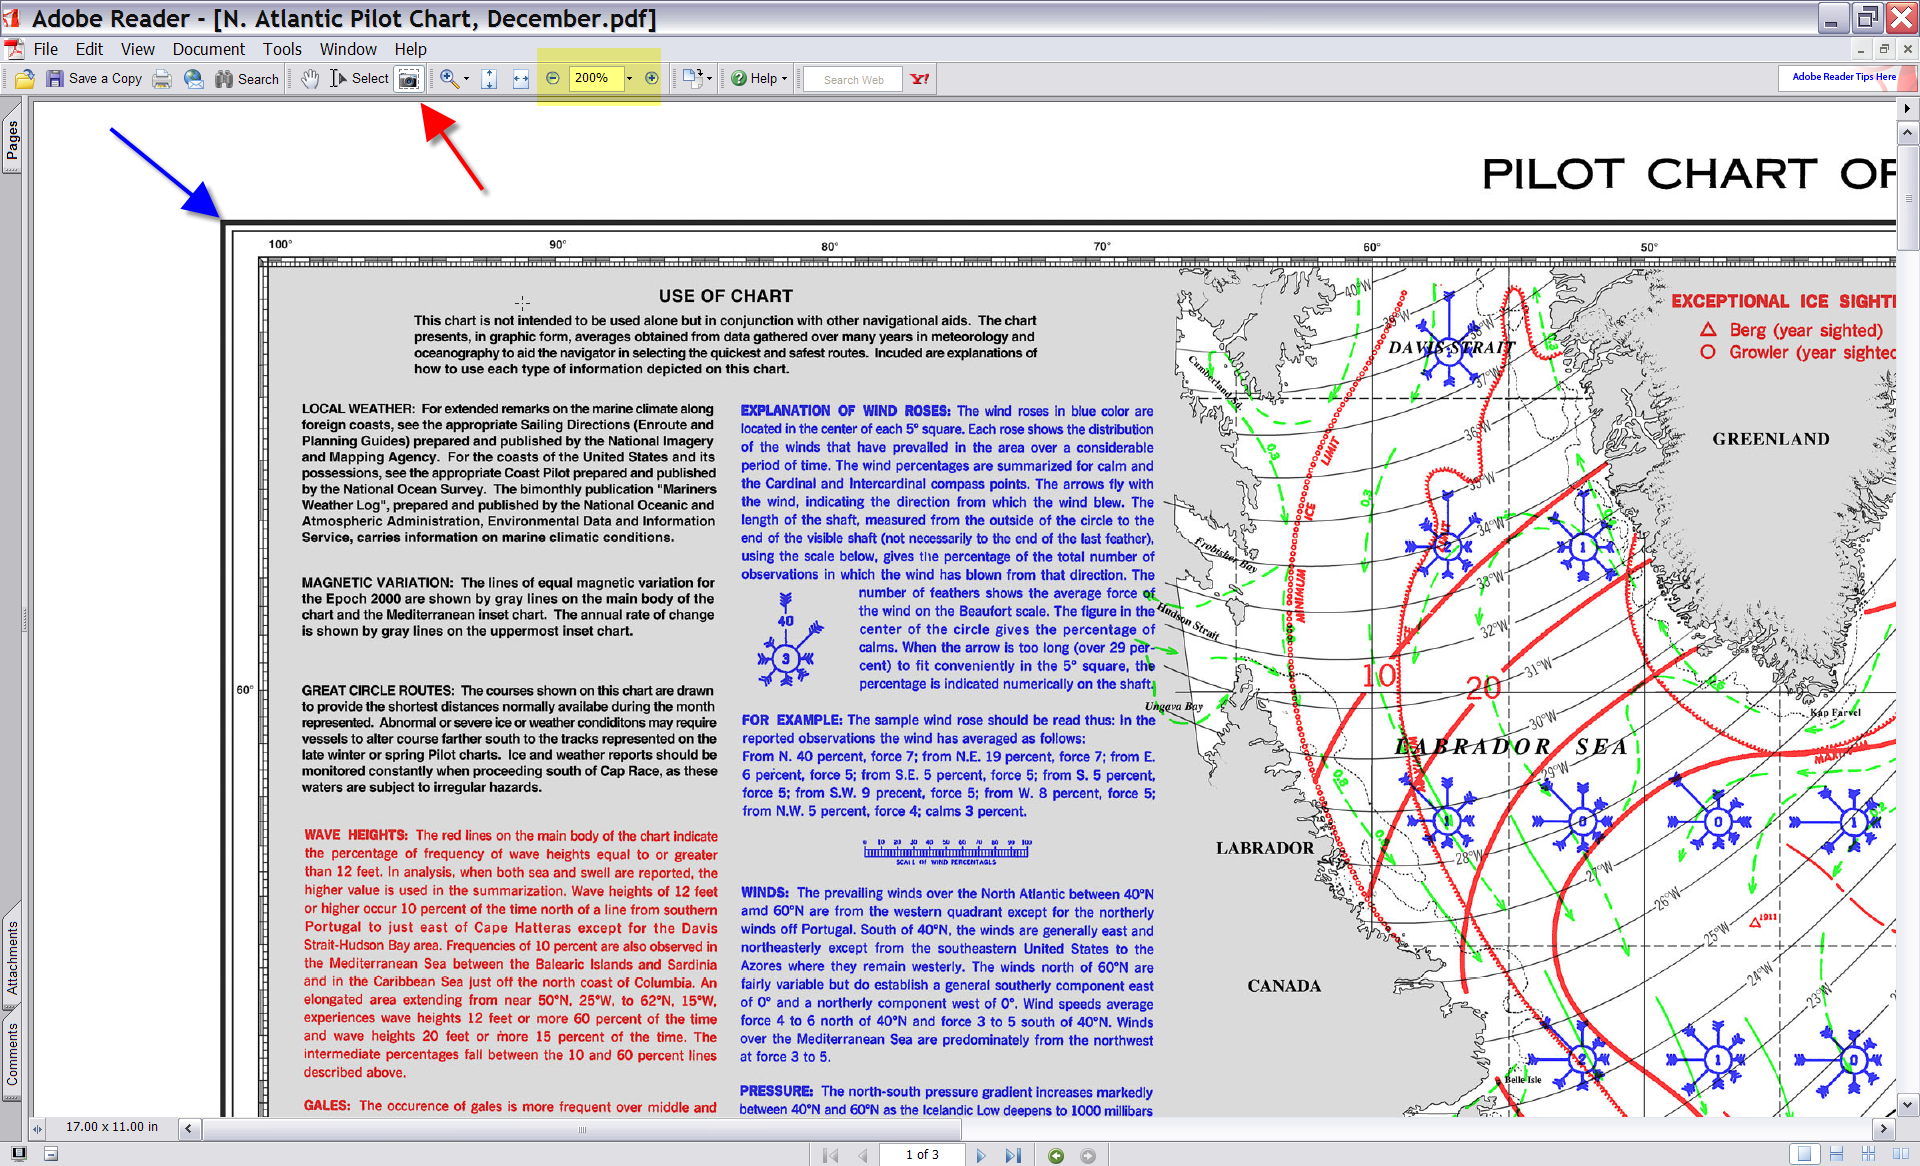 Now
you could go ahead and extract the chart as displayed above, but the chart
resolution may not be satisfactory once you import it into Fugawi. I prefer
to zoom the document to at least 200% (yellow highlight in the screen on the
right) before using the Snap Shot Tool to capture the chart. Now
you could go ahead and extract the chart as displayed above, but the chart
resolution may not be satisfactory once you import it into Fugawi. I prefer
to zoom the document to at least 200% (yellow highlight in the screen on the
right) before using the Snap Shot Tool to capture the chart.The Pilot Chart PDF documents were generated at the same resolution as the paper images, which is much greater than almost any computer screen resolution. The zoom level in Adobe Reader refers to the size of your display screen not the base resolution of the document. So the higher you set the zoom value before you do the extract, the greater the resolution of the resultant chart. There is an effective limit to how high you can set the zoom level in Adobe Reader, which is apparent when the screen image produced by Reader gets that over-zoomed fuzziness. You cannot exceed the resolution of the original document that was scanned into the PDF file. If you do it will just look like all those other raster charts you over-zoomed with your chart plotting software. To get the maximum zoom level possible, keep zooming in until the image starts to get fuzzy, then zoom back out until it is in focus once again. That is your maximum zoom level for extraction. On my computer I have found that 200% is the most effective zoom level and 400% is the upper limit of what I can extract. |
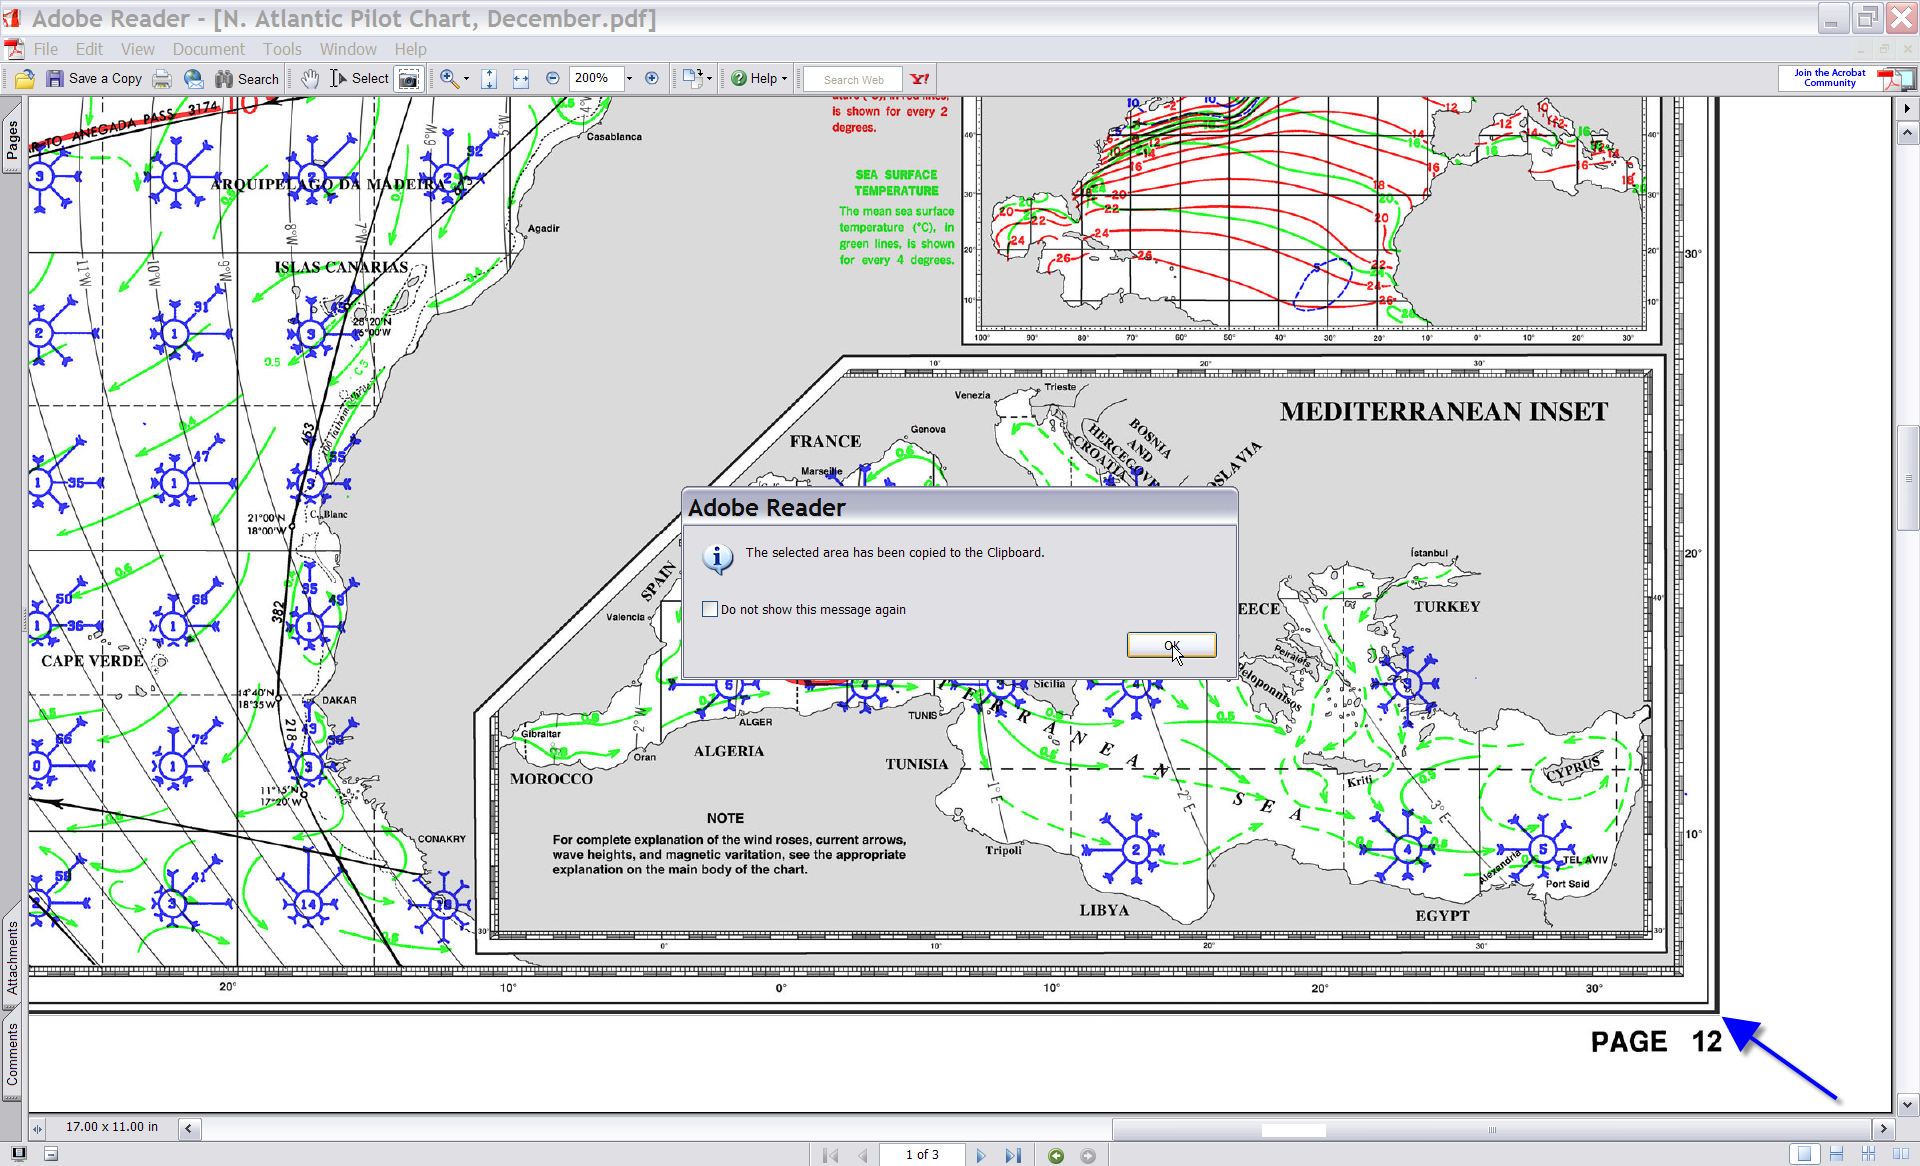 Using a high zoom value makes the selection process a little more cumbersome as it requires panning the screen from the upper left corner (screen above) to the lower right corner (screen on the right). There is a message box on the screen generated by Adobe Reader that says the selected portion of the document has been copied to the Clipboard. Most people, myself included, would click on the "Don't Show This Message Again" box and suppress this message box. I left it in for the purpose of clarity in the screen capture. That's all there is to put the entire chart image on the Clipboard. You can use higher zoom levels and get a higher resolution chart, but it may significantly slow down the process depending on the speed of your CPU and the amount of memory available on your system. |
| Step 2: Save the Chart Image As a Graphic File |
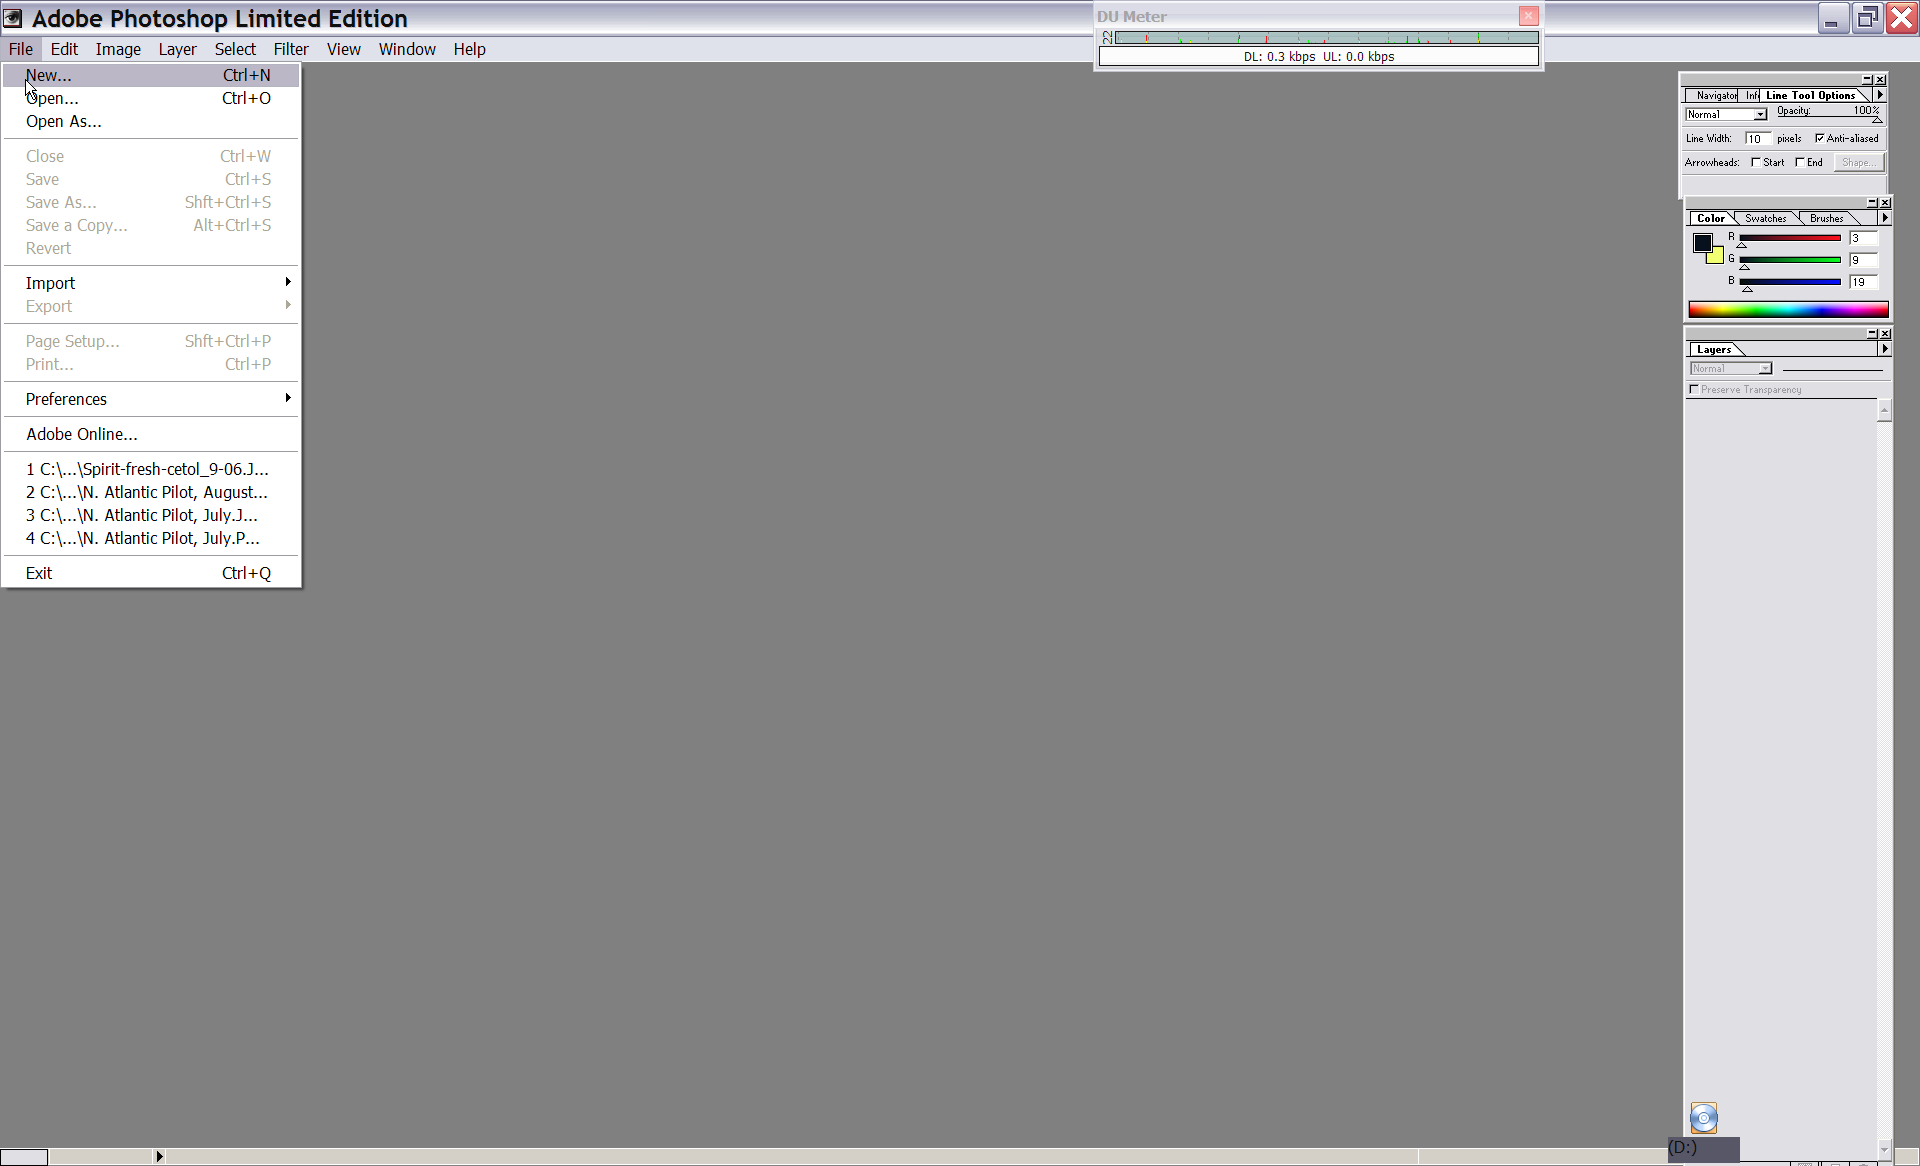 For this step I have used Adobe PhotoShop 5.0 LTE, a Lite version of an old and unsupported level of this software. It is what I have and I use it for most of my work with graphic files. Someday I'll have to upgrade to the latest version. In the screen on the right I have selected New from the File menu to create a blank image in Photoshop. |
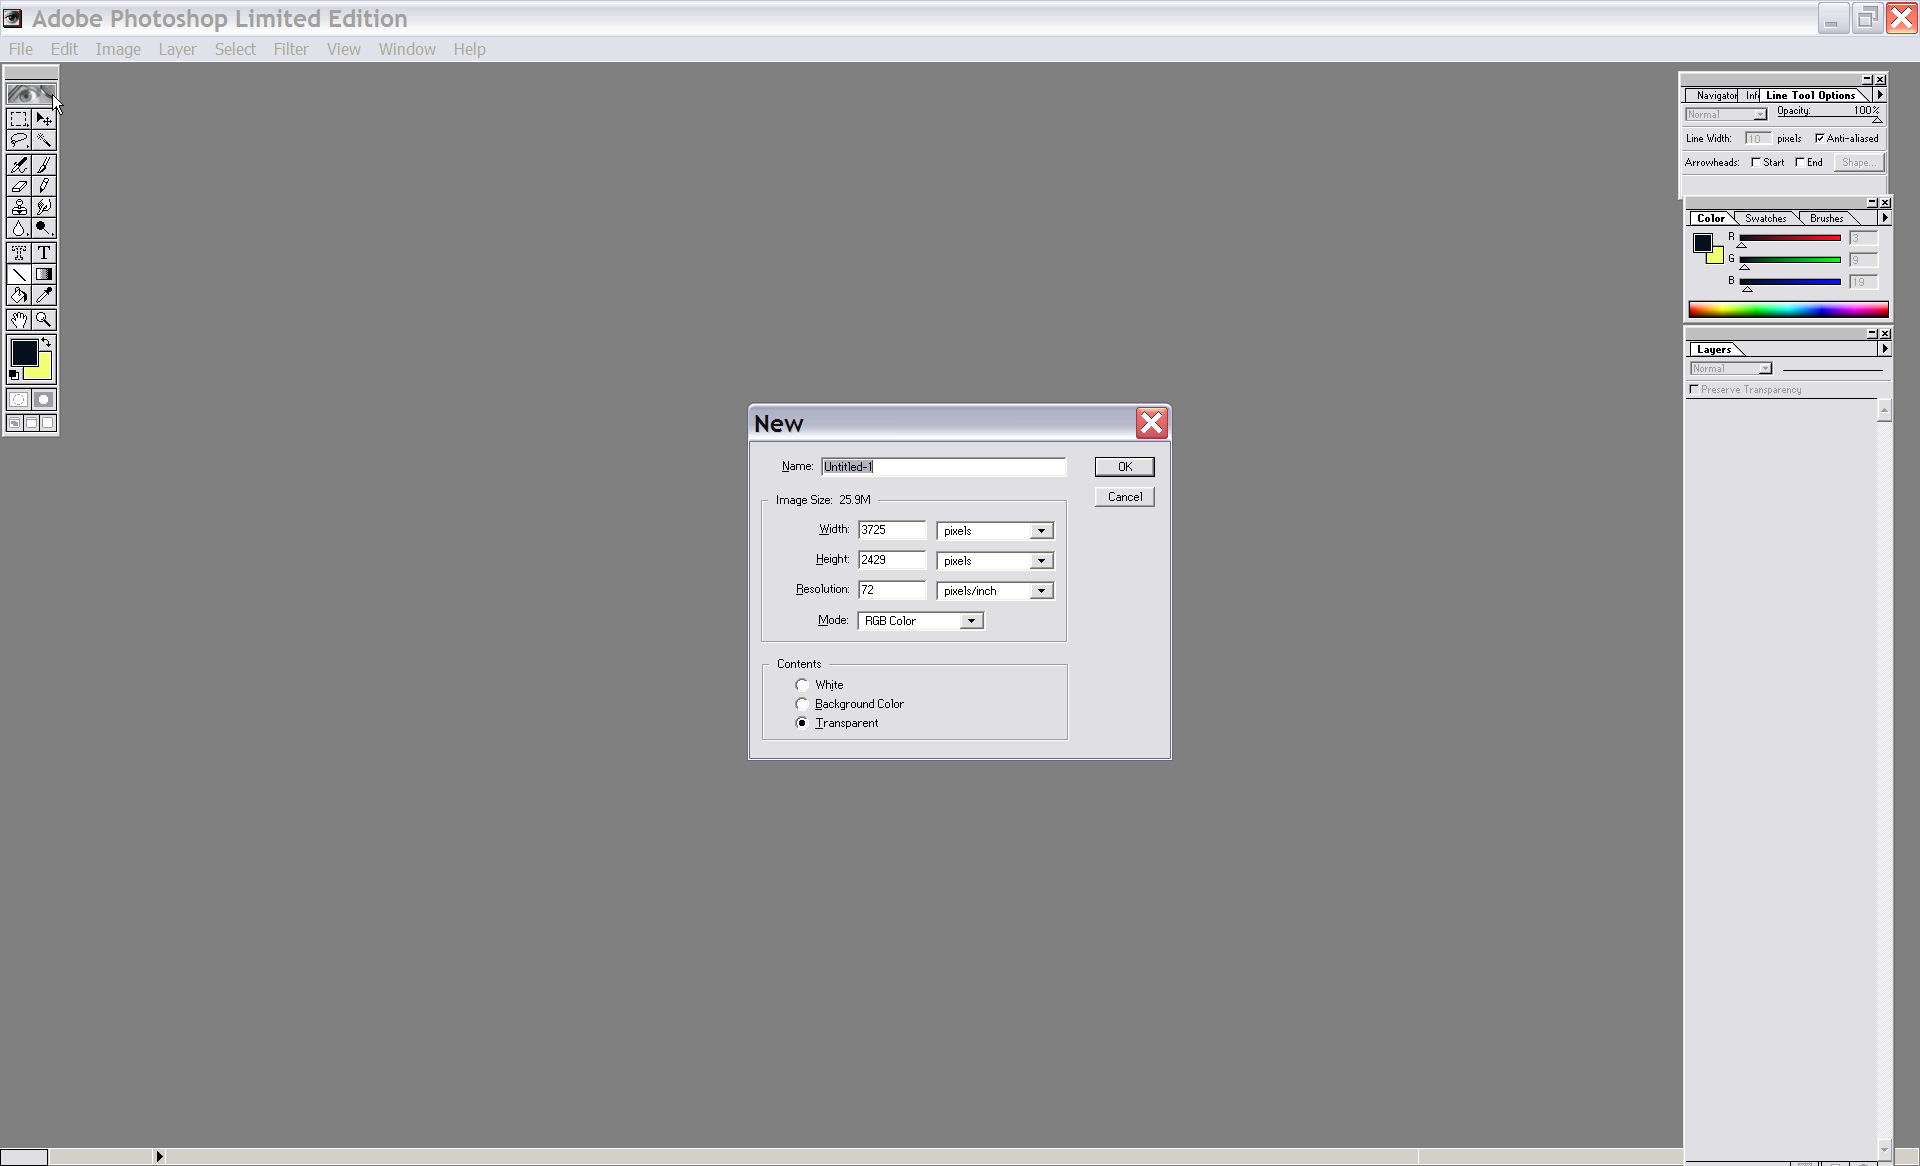 One
nice thing about using Adobe is that it determines the size of the graphic
on the Clipboard and offers those dimensions for the blank file created by
the New command. Other graphic software may do the same, but I
suspect this nice feature may be the result of Adobe owning both Photoshop
and Reader. One
nice thing about using Adobe is that it determines the size of the graphic
on the Clipboard and offers those dimensions for the blank file created by
the New command. Other graphic software may do the same, but I
suspect this nice feature may be the result of Adobe owning both Photoshop
and Reader.Without this feature you may have to make the new image oversized and crop it once the image is pasted. In the screen above, PhotoShop provides a recommended size for the New file, which is exactly the dimensions of the graphic I copied onto the Clipboard using Adobe Reader. |
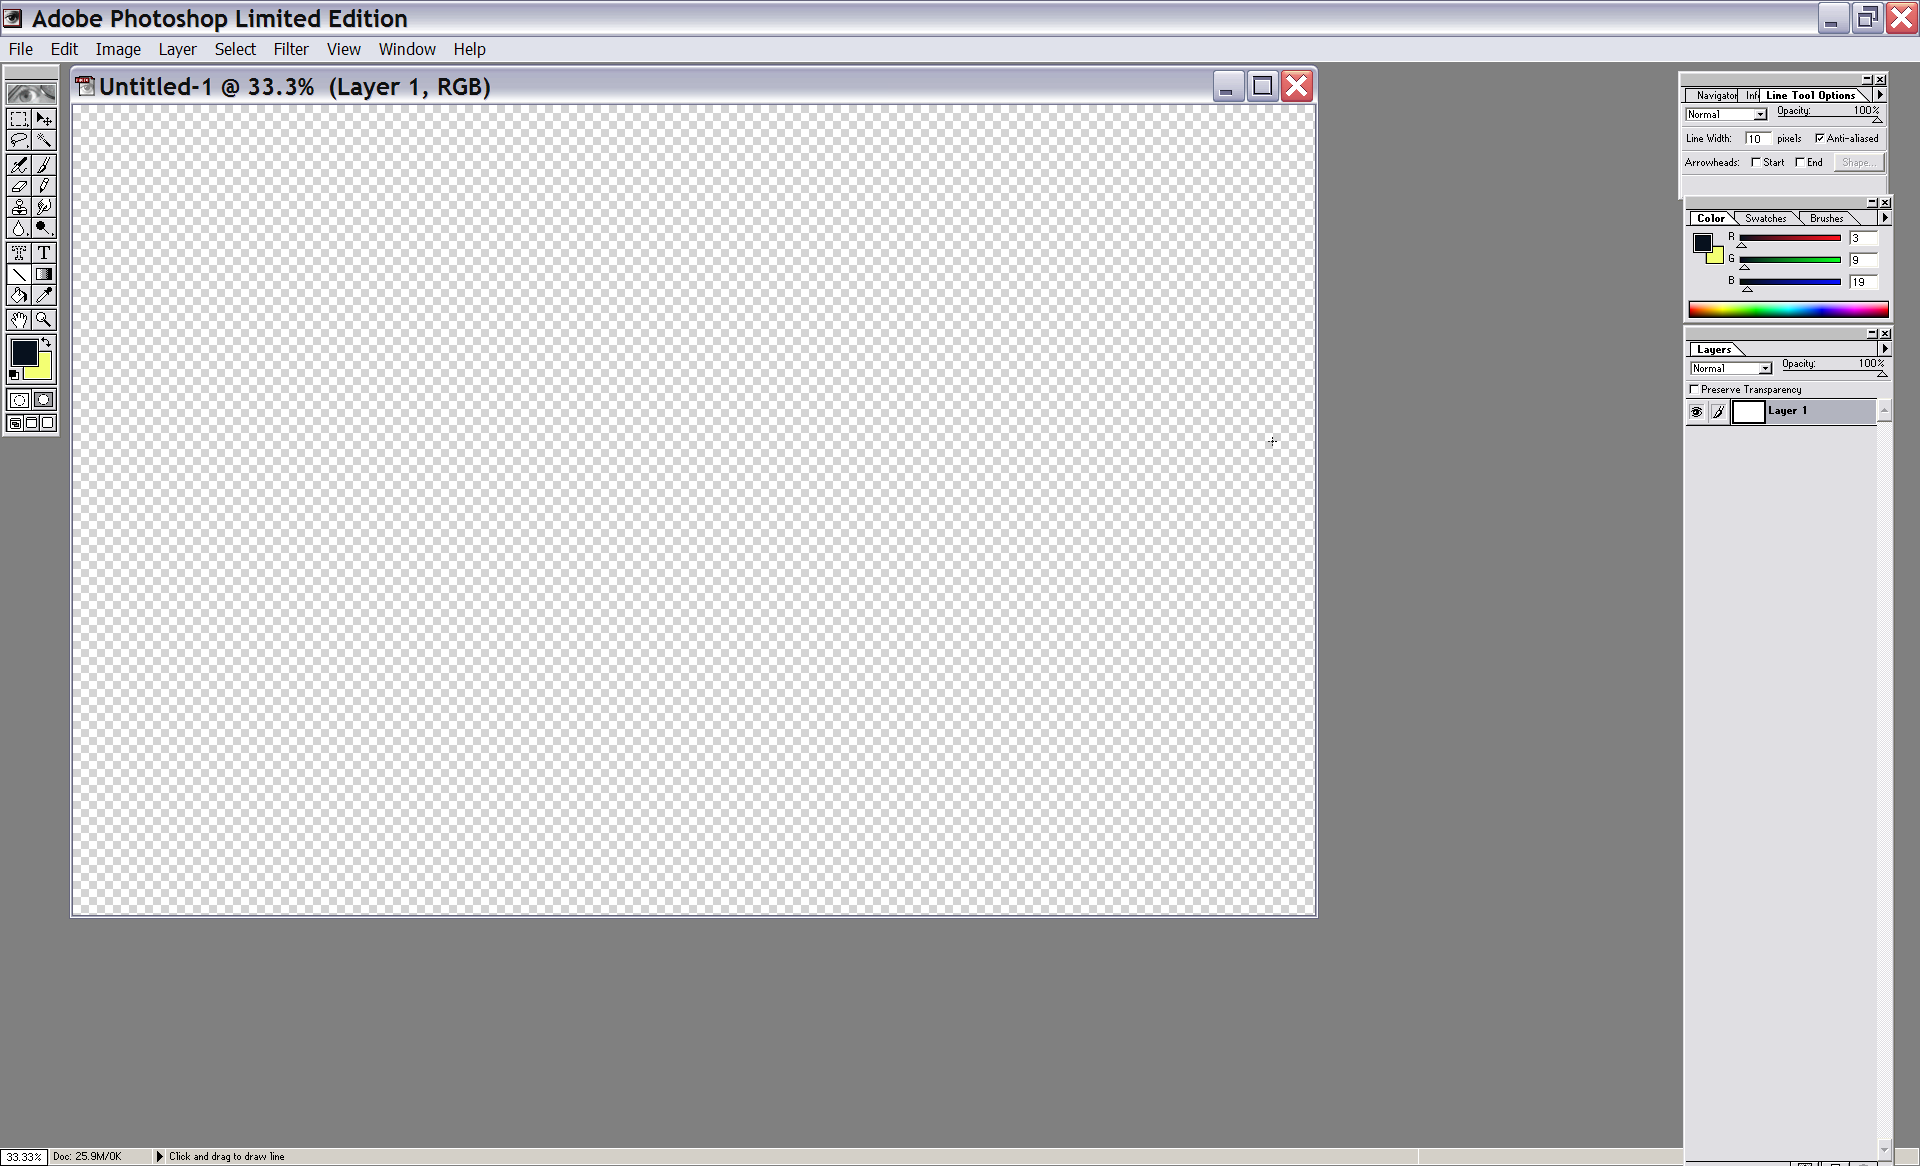 In
this screen the New image file has been created in PhotoShop. In
this screen the New image file has been created in PhotoShop. |
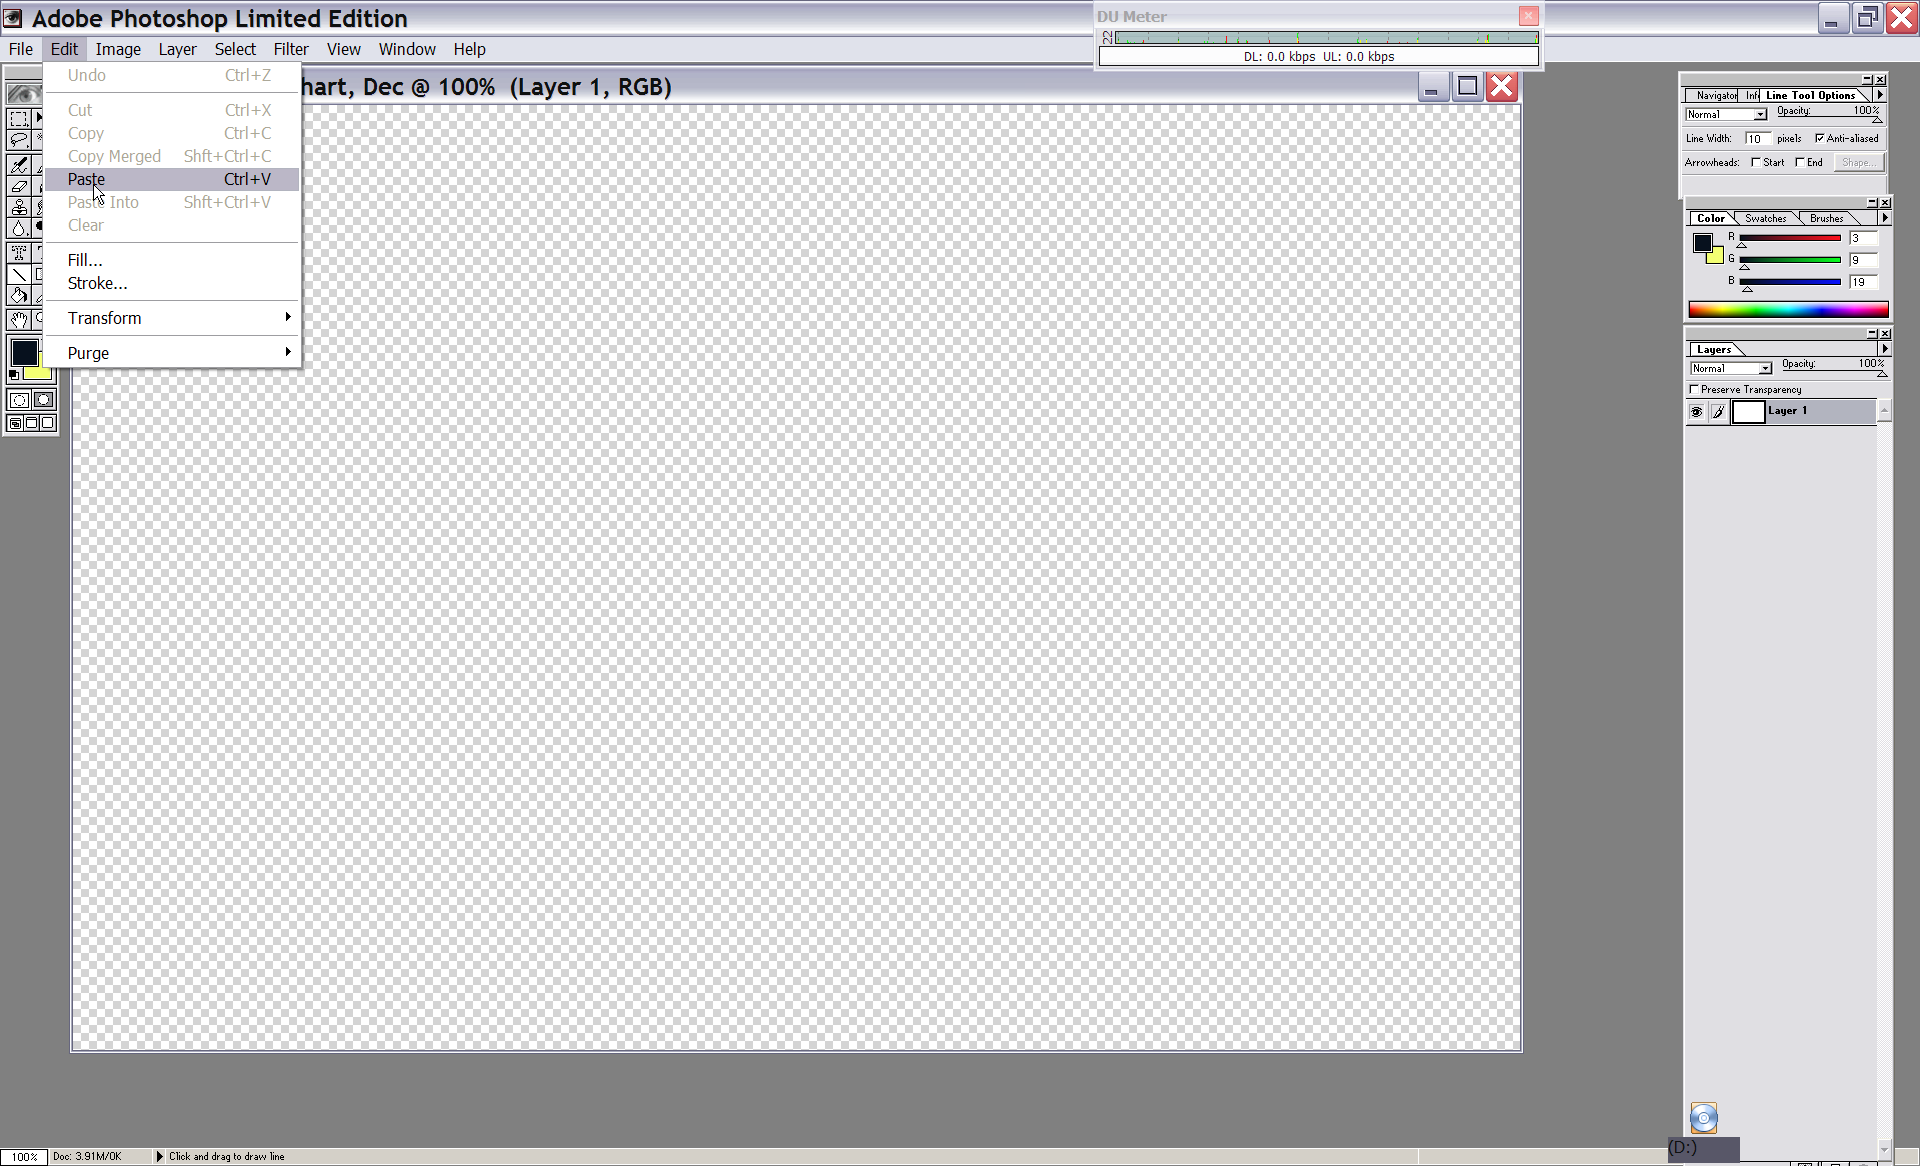 Now
I've initiated the pasting of the Clipboard image into the blank PhotoShop
file using the Edit/Paste menu command. Now
I've initiated the pasting of the Clipboard image into the blank PhotoShop
file using the Edit/Paste menu command. |
 The December Pilot Chart has been pasted into the PhotoShop file. The December Pilot Chart has been pasted into the PhotoShop file.Notice that it has stored the chart image in Layer 1 of the PhotoShop graphic file. This makes the current format of the chart unique to PhotoShop and it cannot be saved in a industry standard format until this formatting has been removed. |
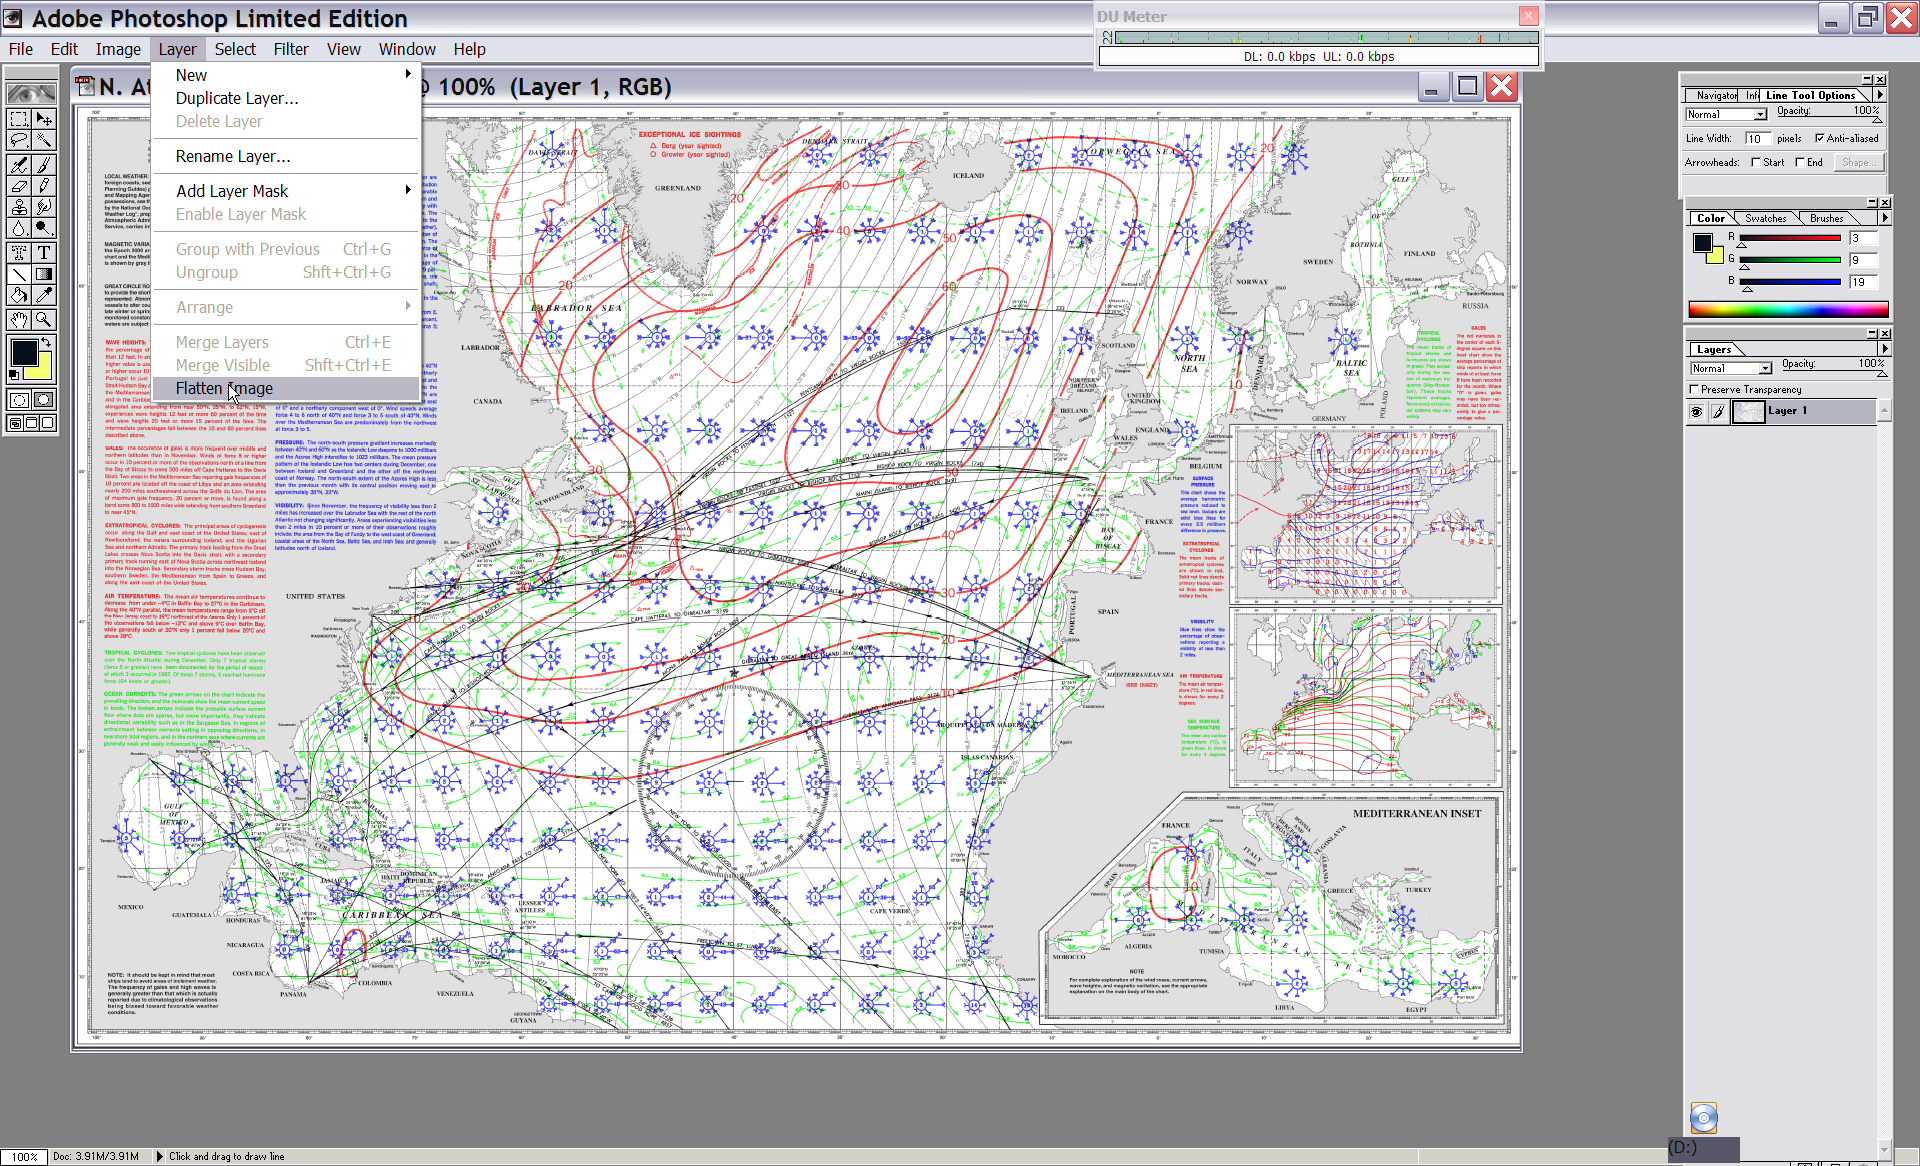 To
do this I have selected the Layer/Flatten Image menu command. To
do this I have selected the Layer/Flatten Image menu command. |
 Finally
I saved the chart in JPEG format and I am ready to import it into Fugawi. Finally
I saved the chart in JPEG format and I am ready to import it into Fugawi. |
| Step 3: Import the Pilot Chart Into Fugawi (or Other Software Package) |
 Now
we switch to Fugawi. If you click on the screen thumbnail on the right and
down load the full resolution image you may notice that the screen
resolution has changed from those above. This is because I used my primary
computer to perform the extract from the PDF file and the conversion to
JPEG. This system has a screen resolution of 1920x1200. I run Fugawi on my
navigation computer, which has a significantly smaller screen. If you
have more than one computer available to you, use the one with more memory,
faster CPU and higher screen resolution for the PDF extract process. Now
we switch to Fugawi. If you click on the screen thumbnail on the right and
down load the full resolution image you may notice that the screen
resolution has changed from those above. This is because I used my primary
computer to perform the extract from the PDF file and the conversion to
JPEG. This system has a screen resolution of 1920x1200. I run Fugawi on my
navigation computer, which has a significantly smaller screen. If you
have more than one computer available to you, use the one with more memory,
faster CPU and higher screen resolution for the PDF extract process.In the screen capture I have started the chart calibration, which is the process by which Fugawi imports a graphic file and turns it into a navigation chart. I am running Fugawi 4.xx, if you are running an earlier or later version the menus may be different, but the basic process hasn't changed. |
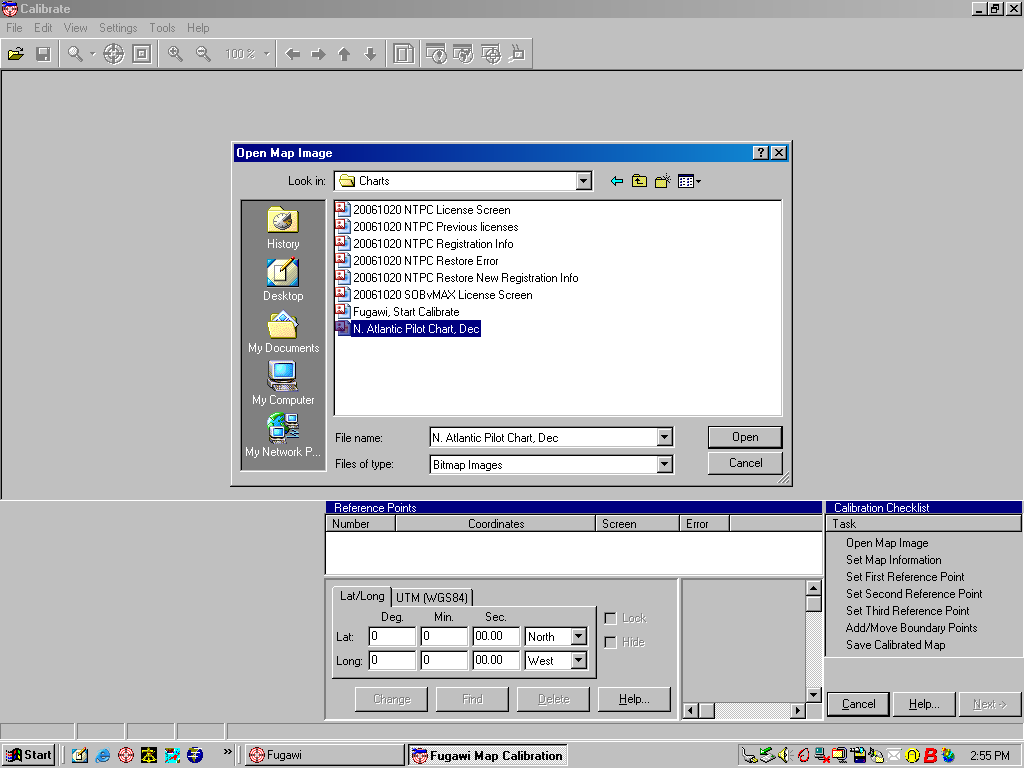 The
first step in the calibration process is to load the graphic file that
contains the chart image. The
first step in the calibration process is to load the graphic file that
contains the chart image. |
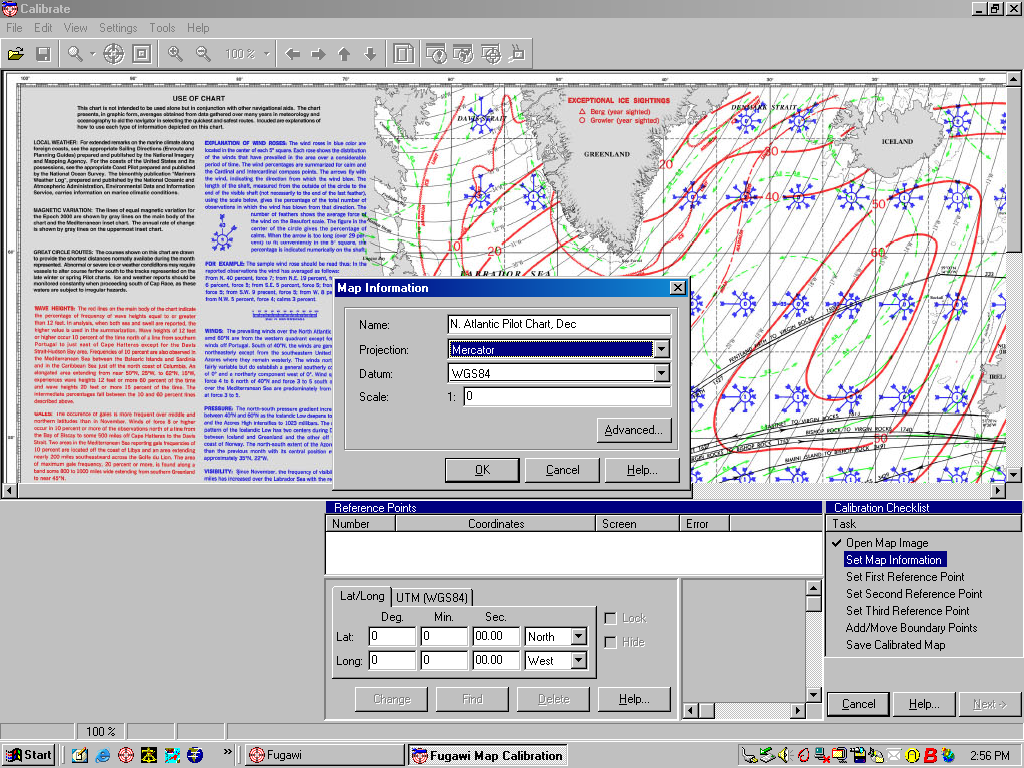 After
the chart image has been loaded into the calibration program, Fugawi needs
to be told what chart projection is used in the image. The Pilot Charts are
Mercator Projections. After
the chart image has been loaded into the calibration program, Fugawi needs
to be told what chart projection is used in the image. The Pilot Charts are
Mercator Projections. |
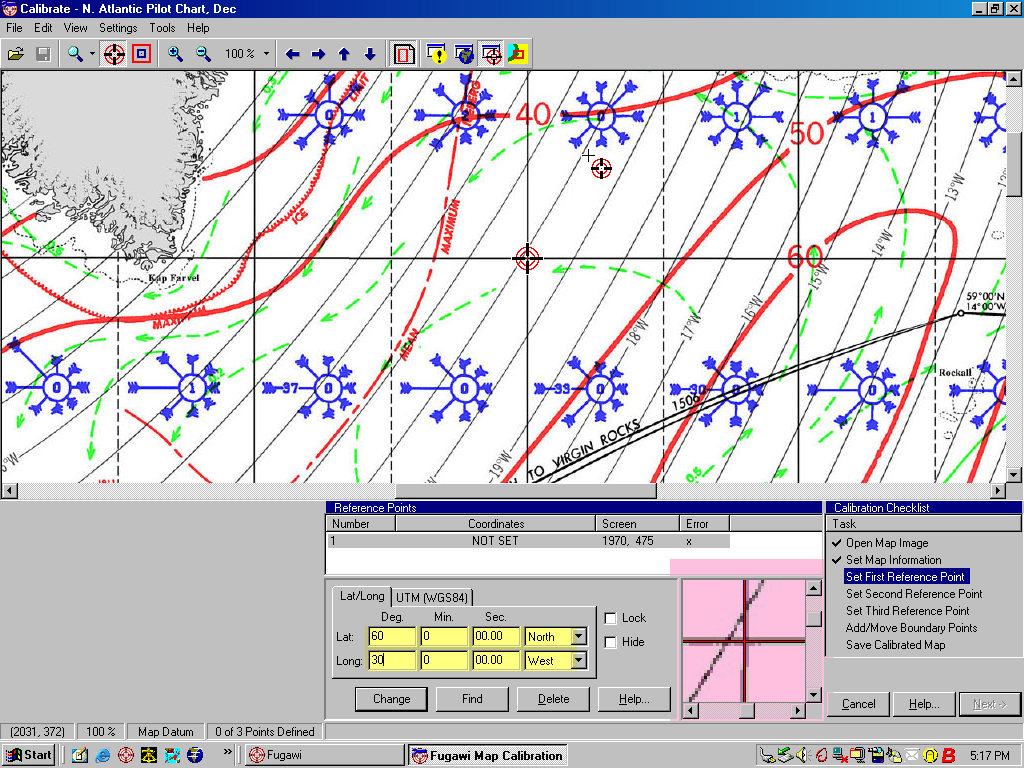 Next
you must specify three reference positions on the chart image so Fugawi can
determine how to plot latitude and longitude on the resultant chart. In the
screen image on the right I have set the first reference point (Circular Red
Icon near the center of the chart). Using the mouse I placed it has close
as I could to the intersection a latitude and longitude line on the chart.
I then used the fine adjustment window (pink highlight) to tweak the
selected point so it is as close as possible to the intersection of the
lines. Then I entered the latitude and longitude of this point (yellow
highlight). Next
you must specify three reference positions on the chart image so Fugawi can
determine how to plot latitude and longitude on the resultant chart. In the
screen image on the right I have set the first reference point (Circular Red
Icon near the center of the chart). Using the mouse I placed it has close
as I could to the intersection a latitude and longitude line on the chart.
I then used the fine adjustment window (pink highlight) to tweak the
selected point so it is as close as possible to the intersection of the
lines. Then I entered the latitude and longitude of this point (yellow
highlight).
When you extract a chart image for import into Fugawi it is not necessary to extract the entire image of the chart; however, it is helpful to get at least one horizontal and one vertical boundary of the chart so you can read the values for the latitude and longitude lines used to calibrate the chart. |
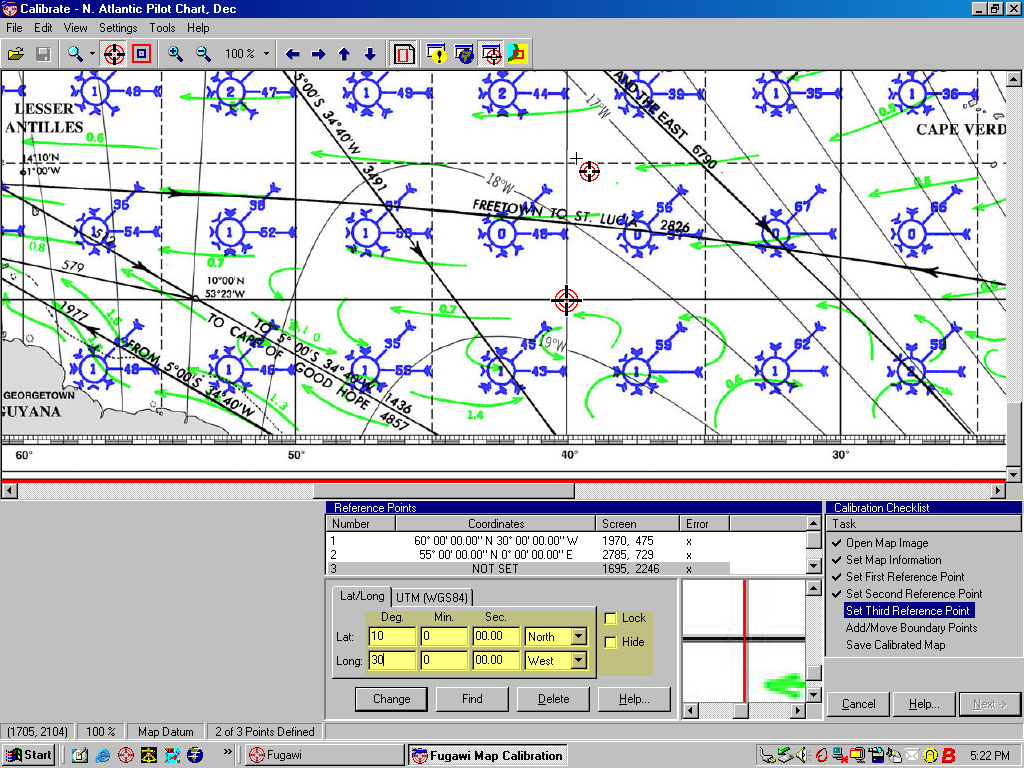 I
then specified the 2nd and 3rd (screen on the right) reference points for
Fugawi. I
then specified the 2nd and 3rd (screen on the right) reference points for
Fugawi.Then click next twice and the chart image has been calibrated and is ready to be imported into Fugawi. Fugawi opens a chart save window which allows you to specify the name of the chart and where in the Fugawi chart library to store the new chart. |
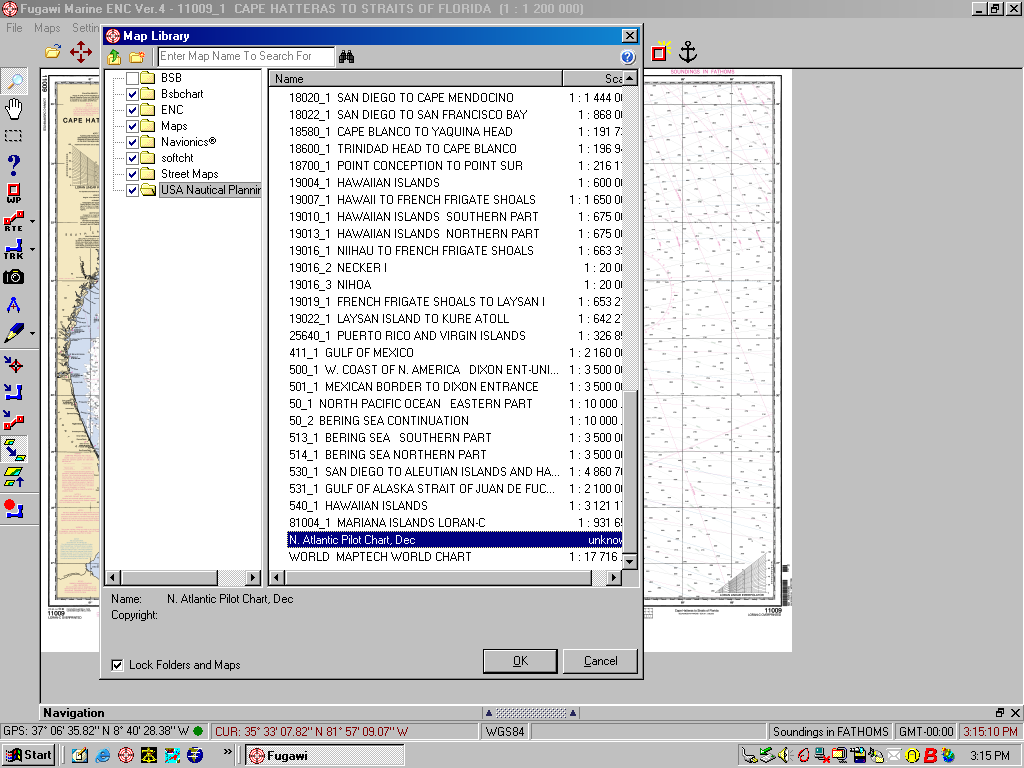 After
the chart has been calibrated and saved in the map library you can load it just as any other raster chart
in the Fugawi library. After
the chart has been calibrated and saved in the map library you can load it just as any other raster chart
in the Fugawi library. |
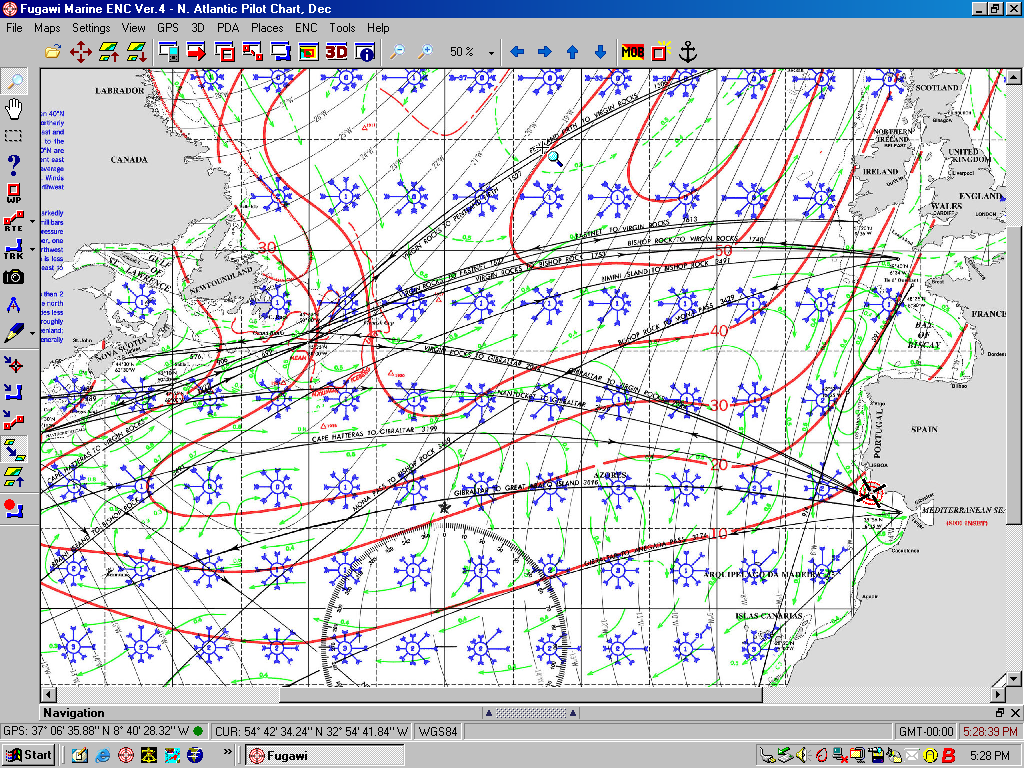 Fugawi
has now loaded the December Pilot Chart as a navigation chart.
Since this was done on my navigation computer and the GPS was powered up,
Fugawi has plotted my position in Lagos, PT (right side of the screen). Fugawi
has now loaded the December Pilot Chart as a navigation chart.
Since this was done on my navigation computer and the GPS was powered up,
Fugawi has plotted my position in Lagos, PT (right side of the screen). |
 Because
I used a 200% resolution in Adobe Reader to extract the chart image, I can
now zoom in with Fugawi just as with any other chart. Because
I used a 200% resolution in Adobe Reader to extract the chart image, I can
now zoom in with Fugawi just as with any other chart. |
| There is a small danger in using the Pilot Charts in this manner. The
ability to manipulate these charts with sophisticated chart plotter software may
allow the user to see a greater level of accuracy and functionality in these
charts than exists or was intended. These are obviously not navigation
charts. Nor are they route planning charts as they really contain no
navigational information. They are a graphical representation of the
climatology of an portion of the worlds oceans. They are not forecasts.
They are merely a norm derived from very limited data. There are not a lot
of weather observation stations in the ocean. Mostly the data in these
charts comes from ship observations, not always the most reliable data. So the Pilot Charts have a very limited use in the chart plotter. They can be used to validate or refine a navigational strategy developed from conventional navigation charts. Once the voyage begins the real weather conditions should determine how you implement that strategy, not the information on these charts. Given the limited use that can and should be made of these charts with a chart plotting software package, many will find the process I described above to be too much effort for a very small gain, and I would not argue different. I have gone through the effort to calibrate the North Atlantic Pilot Charts in Fugawi. Consequently any time I want to compare a voyage I am contemplating with Climatology data I can do that in a few seconds. I also do not need to provide space (other than a few 100 MBytes on a hard drive) for the paper charts. Of course the real reason I have imported these charts into Fugawi is because I wanted to see how it could be done. Once accomplished I could see some value in having done so, but that was not the reason I started down this path. |
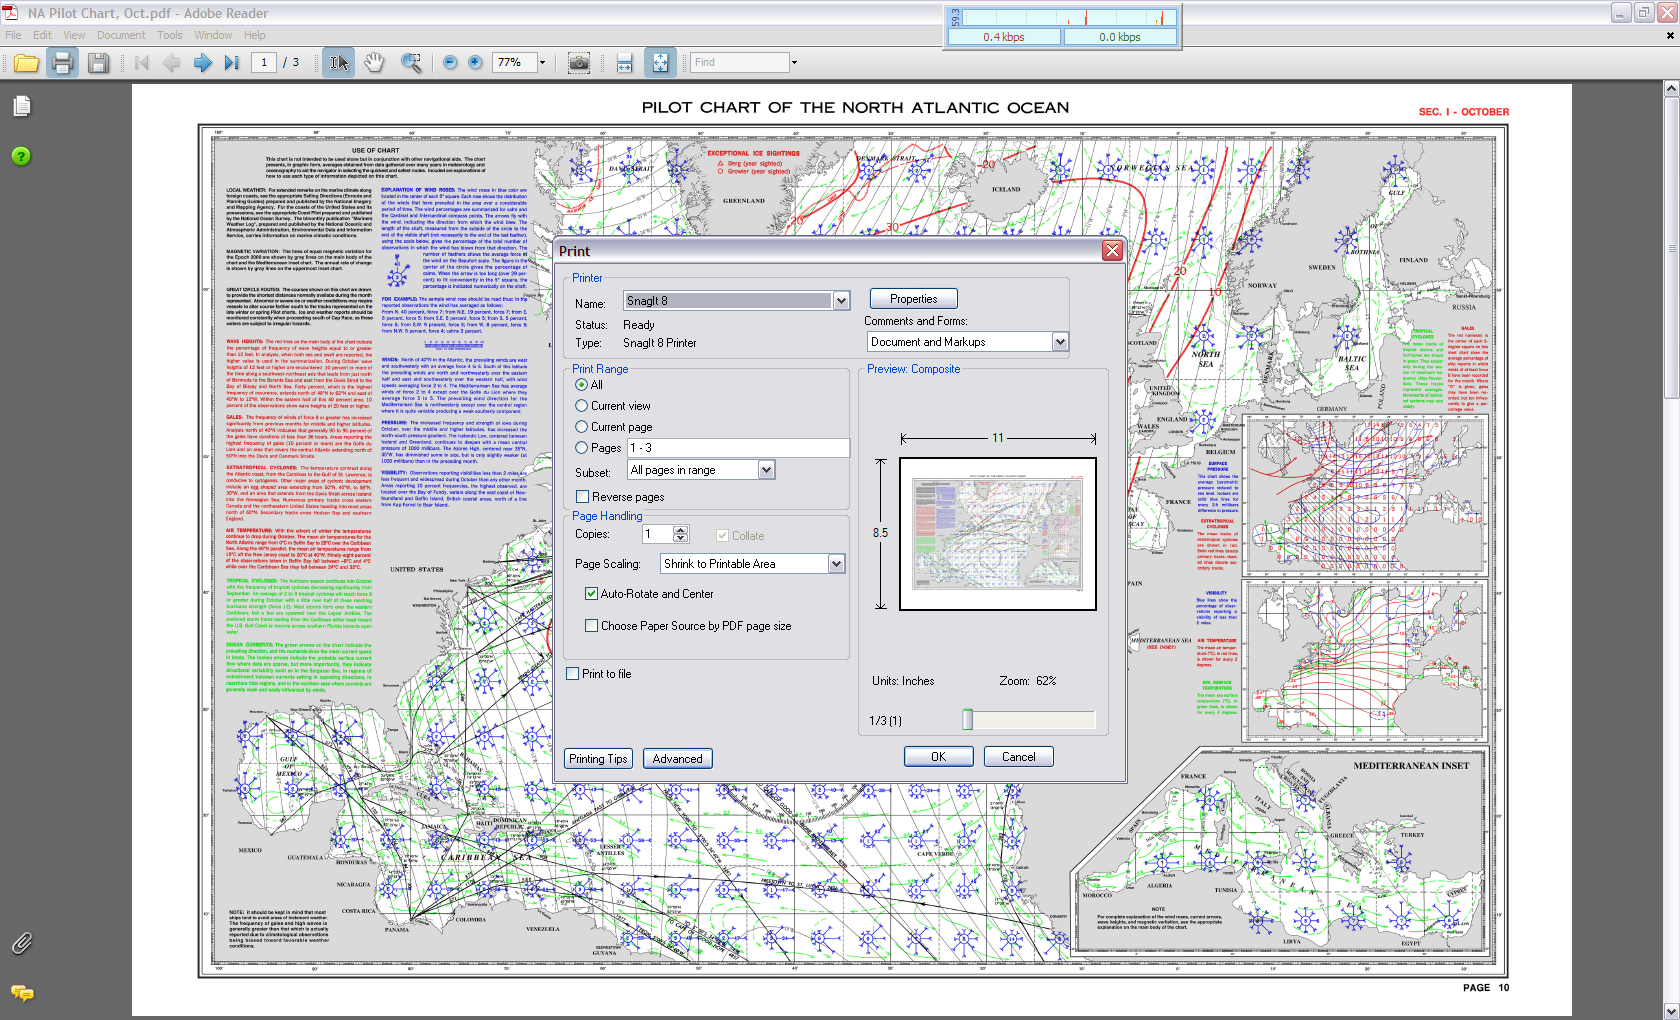
| Image Capture with SnagIt |
|
The process of capturing the Pilot Chart Image on the Clipboard,
transferring it to PhotoShop and then saving the image as a graphic file can
be a little tedious, especially on a less powerfull machine. I have been using SnagIt (TechSmith.Com) for years, principally for screen captures. All of the screen captures on this website were done with SnagIt. I only recently noticed that the latest version of SnagIt provides a printer function. This allows me to print a file directly to SnagIt and then manipulate the print image as a graphic. In the screen capture below I have loaded a Pilot Chart in Adobe Reader and have clicked on the Print button. This brings up the Print Dialogue Box. Here I specify the printer as SnagIt9 and click OK. |
 |
| Once the image is in SnagIt I can save it in JPEG, PNG or any other
graphic format and begin the map calibration function in Fugawi. This
eliminates the cumbersome process of copying to the clipboard in Adobe
Reader and eliminates the need for PhotoShop in the process. SnagIt is a relatively low cost, but very powerful product. I wouldn't purchase it just to capture Pilot Charts, but it has been one the most useful utilities I own. |