| Working With SOB Past Tracks |
|
I have been
using Software On Board (SOB) from DigiBoat for about 4 years as one
of two PC-based chart plotting programs.
The other is Fugawi.
I have found SOB to be a very feature-rich product and an
excellent backup and enhancement to the chart plotting capability of
my Raymarine C-120 Multi-Function Display.
SOB has the most robust AIS implementation I have found in
any of the lower-priced packages I have tested.
I believe it is at least as good an AIS implementation as
that provided by the high-priced packages (e.g., MaxSea).
One SOB feature
I had never used was the Past Tracks recording.
SOB continuously logs the ship's position, COG and SOG, and
other data that may be available on the NMEA network.
This data is recorded in a series of text files in the
PastTracks sub-folder under the SOBvMAX folder.
Until recently the only time I've looked at these files was
to clean them out once or twice a year.
|
|
 In
December, 2008 I found myself trapped by strong easterly winds in
the anchorage at Great Sale Cay, The Bahamas.
With time on my hands and no internet access to entertain I
decided to use the Past Tracks files I generated on the crossing
from Florida
to provide some metrics on the current in the
Gulf Stream.
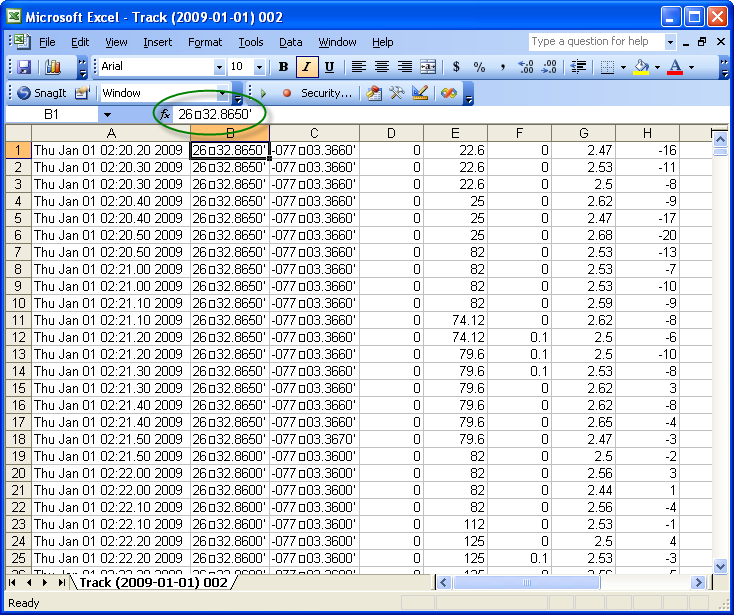
The first thing I discovered is that SOB records the
date/time and the latitude/longitude in a form that Excel cannot
process as numeric values.
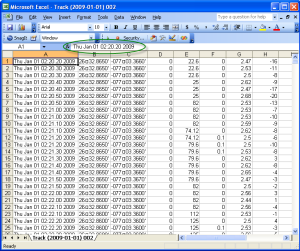
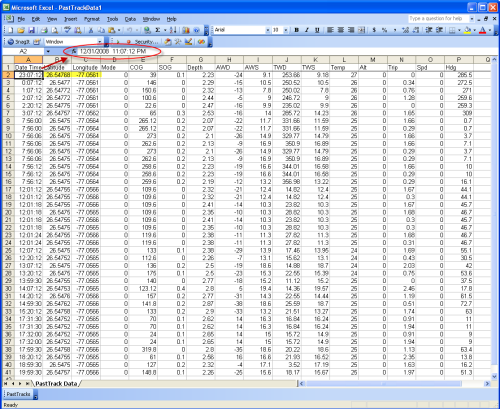
In the screen capture on the left I have loaded one Past
Tracks file into Excel and the data has been parsed correctly into
columns. However the
green ellipse highlights the date/time column from the first row
(you will likely need to double click on the screen capture to view
it at full resolution to see the problem).
This is a text string that my version of Excel (2003) cannot
process. Possibly there
are obscure settings in Excel that will allow it to recognize this
format, but I have not found them.
In order to make use of the rest of the data in each record I
needed a way to convert this column to a standard Excel date/time
value. In
December, 2008 I found myself trapped by strong easterly winds in
the anchorage at Great Sale Cay, The Bahamas.
With time on my hands and no internet access to entertain I
decided to use the Past Tracks files I generated on the crossing
from Florida
to provide some metrics on the current in the
Gulf Stream.
The first thing I discovered is that SOB records the
date/time and the latitude/longitude in a form that Excel cannot
process as numeric values.
In the screen capture on the left I have loaded one Past
Tracks file into Excel and the data has been parsed correctly into
columns. However the
green ellipse highlights the date/time column from the first row
(you will likely need to double click on the screen capture to view
it at full resolution to see the problem).
This is a text string that my version of Excel (2003) cannot
process. Possibly there
are obscure settings in Excel that will allow it to recognize this
format, but I have not found them.
In order to make use of the rest of the data in each record I
needed a way to convert this column to a standard Excel date/time
value.
|
|
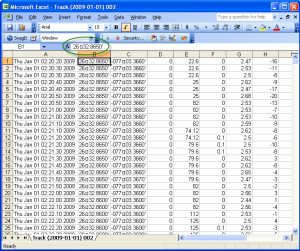 The
next two columns, which contain the latitude and longitude, also
present a similar problem.
SOB has dropped a degree symbol into the field to separate
the degrees from the minutes.
Unfortunately, my Excel doesn't know what to do with this
symbol. So I also need
a way to convert these columns to numeric values. The
next two columns, which contain the latitude and longitude, also
present a similar problem.
SOB has dropped a degree symbol into the field to separate
the degrees from the minutes.
Unfortunately, my Excel doesn't know what to do with this
symbol. So I also need
a way to convert these columns to numeric values.
The rest of the
data in each record is good numeric data.
|
| The
PastTracks Application |
|
I couldn't come
up with an easy way to convert these problem columns into useable
data, so I developed an new Visual Basic for Applications (VBA)
Excel application to process the SOB Past Tracks files.
In addition to converting the problem columns, this new
application will also concatenate multiple Past Track files into a
single Excel worksheet and it will reduce the number of records to a
different increment than that used by SOB to generate the data.
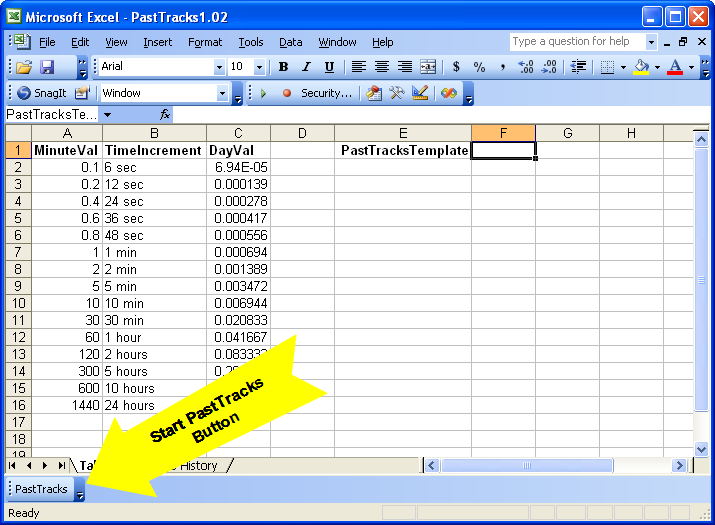
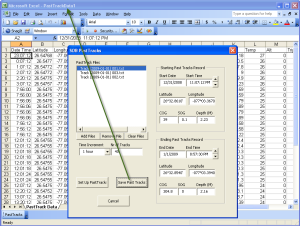
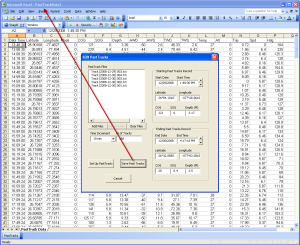
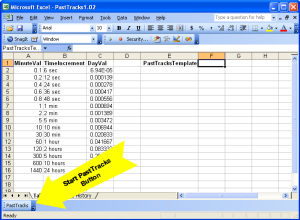 The
screen capture on the left shows the application workbook.
The button ("PastTracks") at the bottom of the worksheet is
used to activate.the program. The
screen capture on the left shows the application workbook.
The button ("PastTracks") at the bottom of the worksheet is
used to activate.the program.
If you wish to use this program you need to download the two
files from the links below.
PastTracks v1.03b Workbook
PastTracksDataTemplate
The template file should be installed on your system as a
normal Excel Template. The PastTracks v1.03b workbook contains
the VBA code that produces the userforms and processing of the SOB
Past Tracks described below. This application was developed in
Office 2003 and may not work properly, if at all, in Office 2007.
|
|
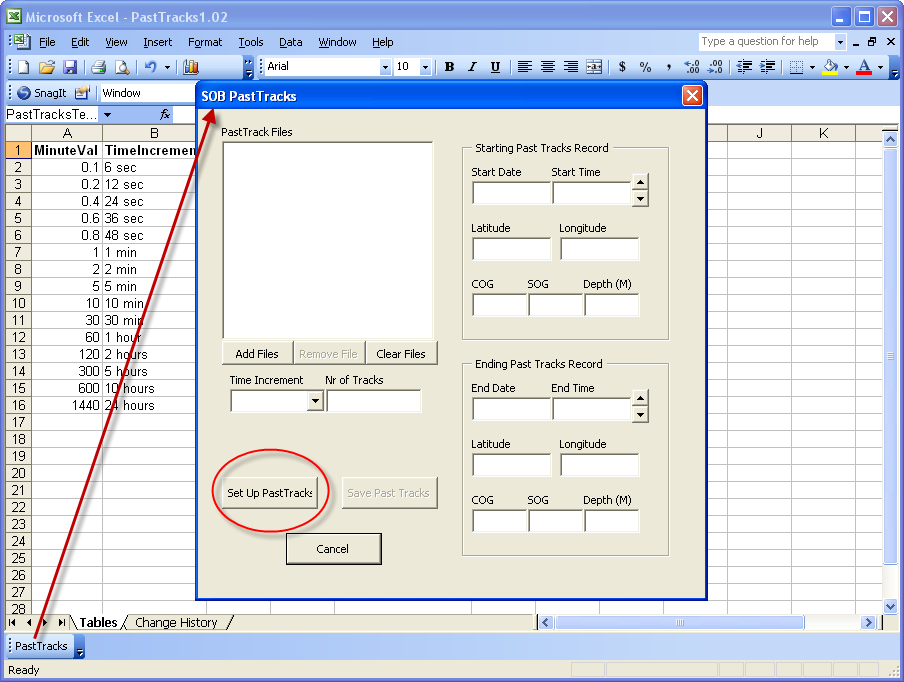
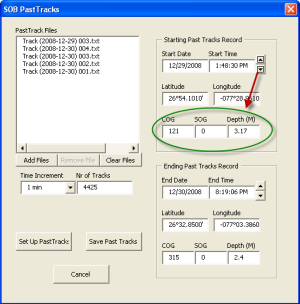
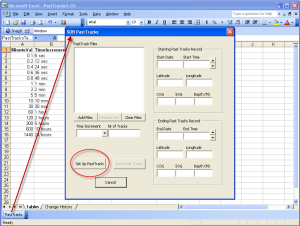 In
the screen capture on the right I have activated the SOB PastTracks
user form by clicking on the button.
The form consists of a listbox to contain the files that will
be processed by the application.
On the right side of the form are two displays for the data
from the starting and ending records in the file group.
Since this is the first time I've activated the application I
need to click on the Set Up button (red ellipse). In
the screen capture on the right I have activated the SOB PastTracks
user form by clicking on the button.
The form consists of a listbox to contain the files that will
be processed by the application.
On the right side of the form are two displays for the data
from the starting and ending records in the file group.
Since this is the first time I've activated the application I
need to click on the Set Up button (red ellipse).
|
| PastTracks Set
Up |
|
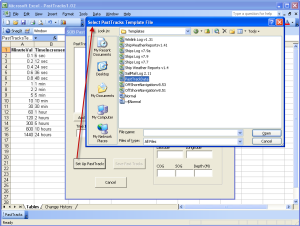 The
principal set up function is to identify the location of the Excel Template for the
resultant Past Tracks workbook.
The template file can be downloaded from the link above and
should be installed as a standard template file.
When I clicked
on the "Set Up Past Tracks" button a file dialog window is opened
and I have clicked on the template file to be used by the
application. The
principal set up function is to identify the location of the Excel Template for the
resultant Past Tracks workbook.
The template file can be downloaded from the link above and
should be installed as a standard template file.
When I clicked
on the "Set Up Past Tracks" button a file dialog window is opened
and I have clicked on the template file to be used by the
application.
|
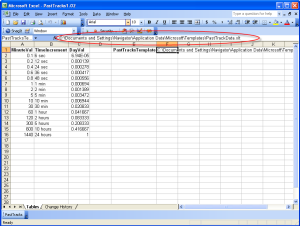 In
this screen I have clicked on the "Open" button in the dialog window
and the file path and file name of the template has been stored in
the "Tables" worksheet.
Currently that is the only set up procedure required to run the application.
Now we can start processing the Past Tracks files. In
this screen I have clicked on the "Open" button in the dialog window
and the file path and file name of the template has been stored in
the "Tables" worksheet.
Currently that is the only set up procedure required to run the application.
Now we can start processing the Past Tracks files. |
| Using Past
Tracks |
|
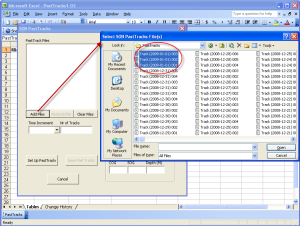 First
I need identify the files to use as input.
To do this I have clicked on the "Add Files" button below the
file list and it has called up another file dialog window.
I have selected 3 files that were created on January 1, 2009. First
I need identify the files to use as input.
To do this I have clicked on the "Add Files" button below the
file list and it has called up another file dialog window.
I have selected 3 files that were created on January 1, 2009.
|
|
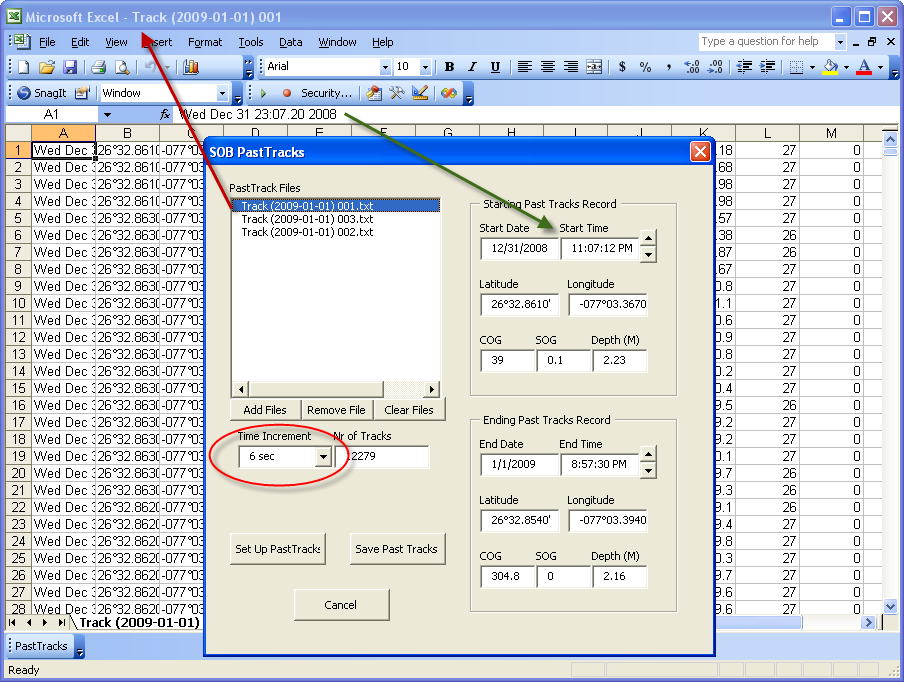
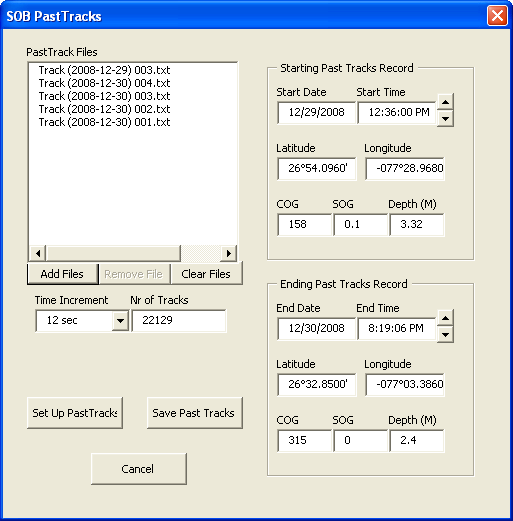
 I
clicked on the "Open" button and those three files are now shown in
the file list. The
application has also opened each of the text files in Excel.
The starting and ending data displays have been populated.
Below the file list the Time Increment drop down list has
been set the time increment in the files and there is an estimate of
the number of records that are contained in the file group. I
clicked on the "Open" button and those three files are now shown in
the file list. The
application has also opened each of the text files in Excel.
The starting and ending data displays have been populated.
Below the file list the Time Increment drop down list has
been set the time increment in the files and there is an estimate of
the number of records that are contained in the file group.
|
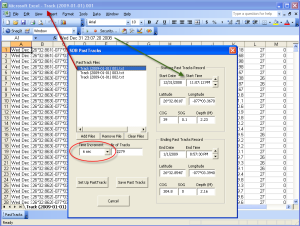
|
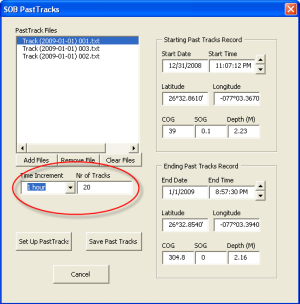 I
don't really want to process all of the data in this file group.
So I have changed the time increment to one hour, which has
reduced the estimated record count to 20. I
don't really want to process all of the data in this file group.
So I have changed the time increment to one hour, which has
reduced the estimated record count to 20.
|
|
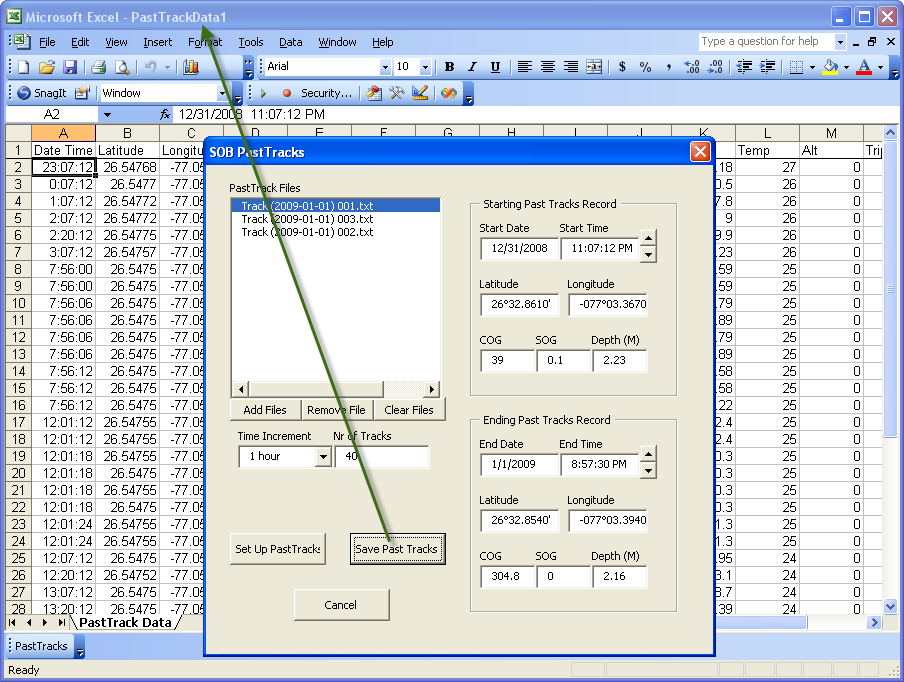
 Then
I clicked on the "Save Past Tracks" and a new Excel Workbook,
"PastTrackData1" has been generated and populated with 40 records
(obviously these two screen captures were not done in sequence, I
can't explain the difference in the record counts). Then
I clicked on the "Save Past Tracks" and a new Excel Workbook,
"PastTrackData1" has been generated and populated with 40 records
(obviously these two screen captures were not done in sequence, I
can't explain the difference in the record counts).
The PastTrackData1 workbook was generated from the template file
identified during the set up process.
|
 The
date/time field in the workbook have been converted to standard
Excel format. The
Latitude and Longitude fields have been converted to degree numeric
values. The
date/time field in the workbook have been converted to standard
Excel format. The
Latitude and Longitude fields have been converted to degree numeric
values. |
|
Using Past Tracks
with Excel Graphics |
|
 In
this screen capture I have picked another set of files that cover
Sarah's passage throught the Sea
of Abaco from Powell Cay to Marsh Harbor. In
this screen capture I have picked another set of files that cover
Sarah's passage throught the Sea
of Abaco from Powell Cay to Marsh Harbor.
|
|
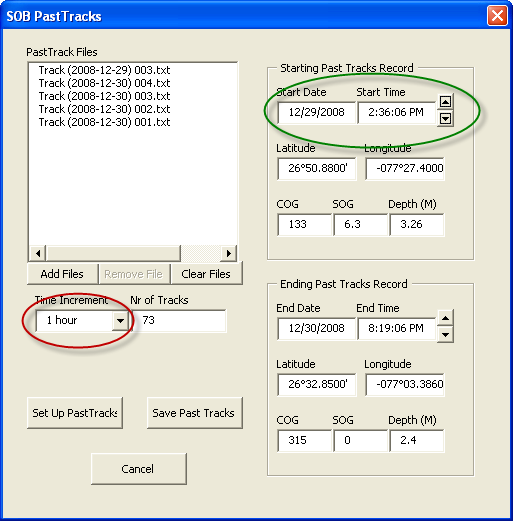
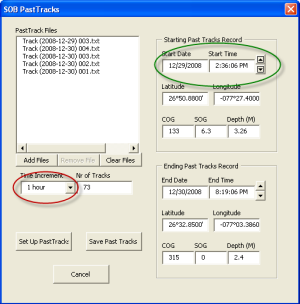 Now
I want to change the starting record to the one just before I pulled
up the anchor in Powell Cay.
To do this I once again changed the increment to one hour and
I have clicked on the spin button to increment the starting time to
the first record that shows Sarah underway (SOG = 6.3 kts). Now
I want to change the starting record to the one just before I pulled
up the anchor in Powell Cay.
To do this I once again changed the increment to one hour and
I have clicked on the spin button to increment the starting time to
the first record that shows Sarah underway (SOG = 6.3 kts).
|
 Next
I decreased the increment to one minute and used the spin button to
backup to the first record that show Sarah not underway (SOG = 0).
Now I have the starting time set to within a minute of
getting Sarah underway at Powell Cay. Next
I decreased the increment to one minute and used the spin button to
backup to the first record that show Sarah not underway (SOG = 0).
Now I have the starting time set to within a minute of
getting Sarah underway at Powell Cay. |
|
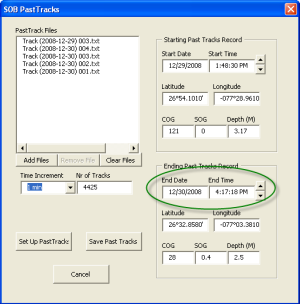 In
the next screen capture I have used the same technique to set the
ending record to one just after I dropped the anchor in Marsh Harbor. In
the next screen capture I have used the same technique to set the
ending record to one just after I dropped the anchor in Marsh Harbor.
|
 After
establishing the starting and ending records to be saved in the
Excel workbook, I changed the time increment to 10 minutes. After
establishing the starting and ending records to be saved in the
Excel workbook, I changed the time increment to 10 minutes.
Now
I have clicked on the "Save PastTracks" button and the
PastTracksData2 workbook has been created with records at ten minute
increments |
|
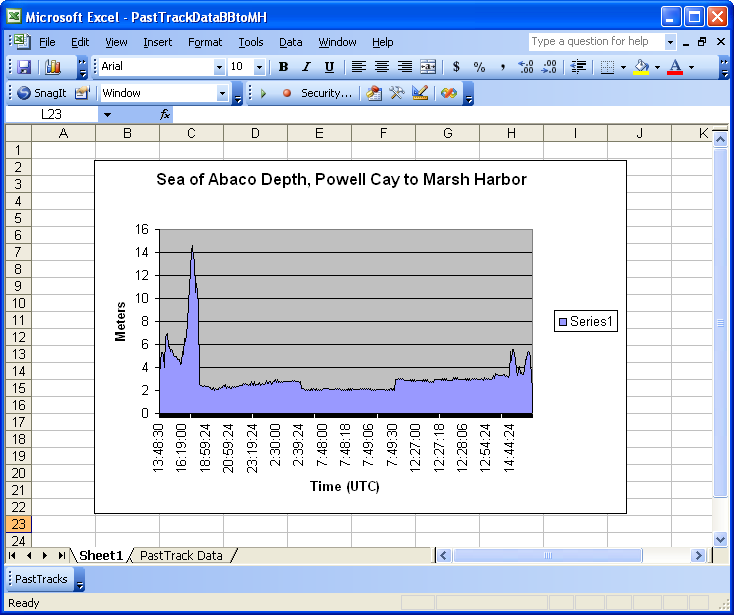
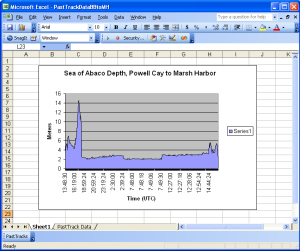 With
this workbook I can use the standard Excel analysis features to
present the data in a graphic format.
In this screen capture I have graphed the sea depth as
recorded by Sarah's depth sounder from Powell Cay to
Marsh Harbor.
Yep the Sea
of Abaco is
pretty shallow, but presented no problems for Sarah's 1.6M draught. With
this workbook I can use the standard Excel analysis features to
present the data in a graphic format.
In this screen capture I have graphed the sea depth as
recorded by Sarah's depth sounder from Powell Cay to
Marsh Harbor.
Yep the Sea
of Abaco is
pretty shallow, but presented no problems for Sarah's 1.6M draught.
|

 In
this screen I have clicked on the "Open" button in the dialog window
and the file path and file name of the template has been stored in
the "Tables" worksheet.
Currently that is the only set up procedure required to run the application.
Now we can start processing the Past Tracks files.
In
this screen I have clicked on the "Open" button in the dialog window
and the file path and file name of the template has been stored in
the "Tables" worksheet.
Currently that is the only set up procedure required to run the application.
Now we can start processing the Past Tracks files.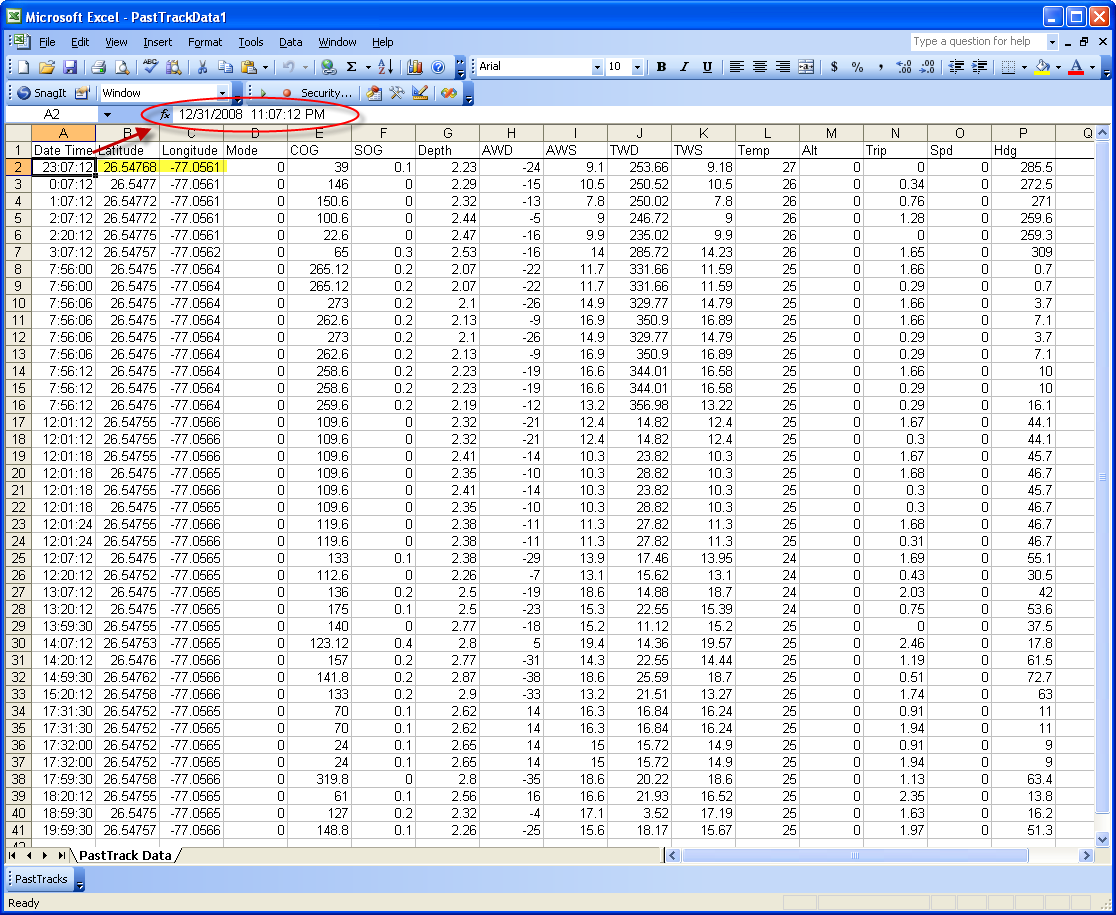 The
date/time field in the workbook have been converted to standard
Excel format. The
Latitude and Longitude fields have been converted to degree numeric
values.
The
date/time field in the workbook have been converted to standard
Excel format. The
Latitude and Longitude fields have been converted to degree numeric
values.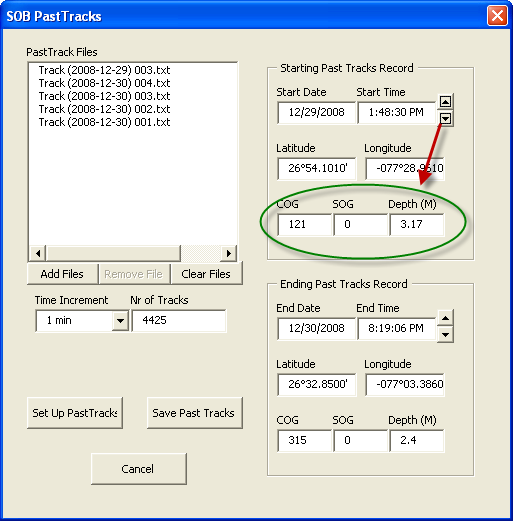 Next
I decreased the increment to one minute and used the spin button to
backup to the first record that show Sarah not underway (SOG = 0).
Now I have the starting time set to within a minute of
getting Sarah underway at Powell Cay.
Next
I decreased the increment to one minute and used the spin button to
backup to the first record that show Sarah not underway (SOG = 0).
Now I have the starting time set to within a minute of
getting Sarah underway at Powell Cay. After
establishing the starting and ending records to be saved in the
Excel workbook, I changed the time increment to 10 minutes.
After
establishing the starting and ending records to be saved in the
Excel workbook, I changed the time increment to 10 minutes.